Industry :
Insurance & Financial Services
The Challenge
The client’s secure, integrated application supported core business functions such as claims management, recovery tracking, severity analysis, and branch-level operations. However, they faced:
- Performance issues in Tableau dashboards, causing delays in accessing critical insights.
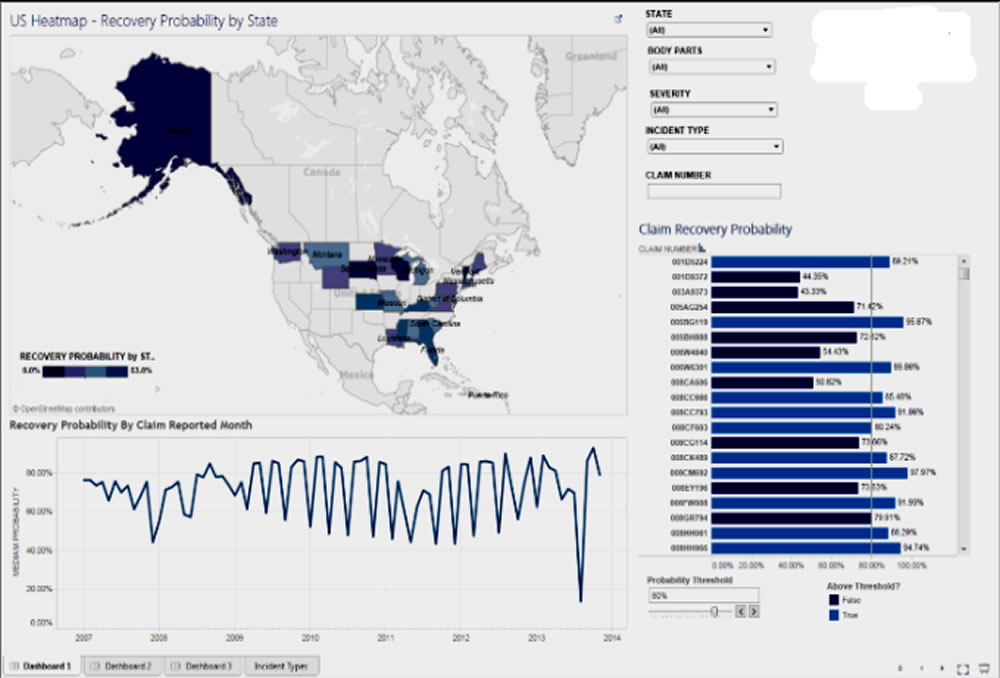
- The need to develop multiple reports and dashboards to analyze claims, severity, and probability thresholds across various locations.
- Limited ability to dynamically adjust and analyze recovery metrics based on different operational parameters.
The Solution
The engagement focused on re-architecting and optimizing the BI reporting framework. Key initiatives included:
- Data Aggregation & Visualization
- Designed and implemented optimized data aggregations for Tableau Dashboard and Tableau Server to handle large datasets efficiently.
- Created interactive reports for claims, severity, and recovery probability analysis.
- Predictive Recovery Model
- Built a model to predict claim recovery probability, categorizing claims into recovery probability buckets for proactive follow-up.
- Dynamic Analysis Parameters
- Introduced parameters for Loss Amount, Recovered Amount, Recovery Probability, and Probability Threshold to allow flexible, scenario-based analysis.
- Quality & Performance Improvements
- Developed quality-check reports to validate aggregated data accuracy.
- Resolved a large backlog of critical reporting issues.
- Performance-tuned slow-running dashboards and recommended database design changes to improve query speed.
- Stakeholder Collaboration
- Worked closely with business teams to gather evolving requirements and implement enhancements iteratively.
Business Impact
- Improved Decision-Making : The predictive recovery model enabled data-driven prioritization of recovery efforts, leading to faster claim resolution.
- Increased Reporting Efficiency : Dashboard load times were reduced by over 60%, enabling real-time access to operational insights.
- Operational Flexibility : Dynamic parameters empowered analysts to explore multiple recovery and loss scenarios without additional development effort.
- Enhanced Data Reliability : Quality validation processes ensured higher accuracy in financial and operational reporting.
- Scalable Architecture : The optimized design allowed easy addition of new reporting dimensions and metrics in the future.
Technology Environment
- BI & Visualization: Tableau Desktop, Tableau Server
- Database: SQL Server 2008