
The Challenge
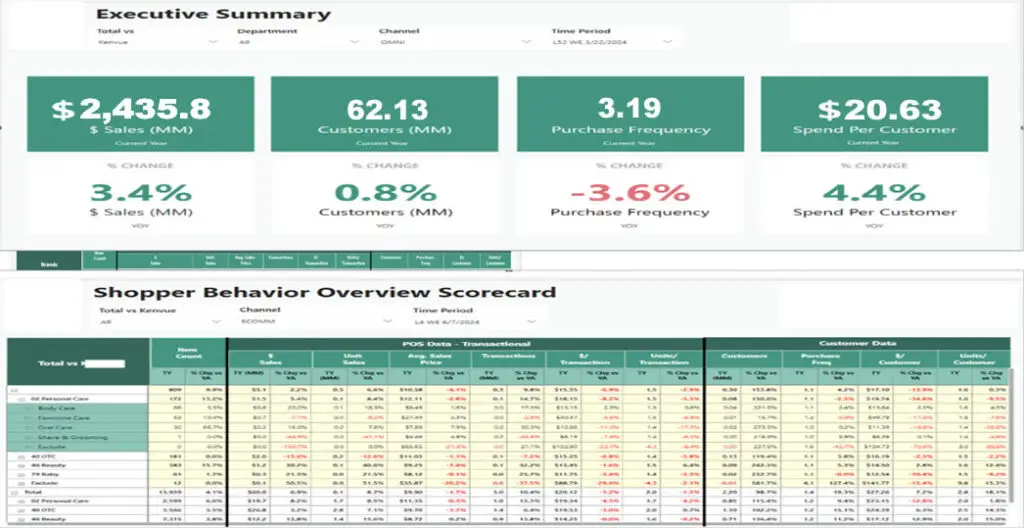
- Our Client Shopper Insights Project in which we built multiple Power BI Reports which provides in-depth transactional and customer data, offering insights into brand-level performance across multiple filters such as categories, channels, and time periods.
- Provides total market vs. brand performance at various levels, providing insights into transactional and customer purchase frequency.
- These reports comprise of aggregated metrics including sales, customer count, purchase frequency, and spend per customer, alongside their respective percentage changes.
- Using all the data which we downloaded from Luminate portal total 700 excels reports consists of multiple categorical data with different Segmentations and Time Periods to show the insights in the form of Power BI reports.
Scope of Project
- Automating & replicating manual approach of extracting Excel Reports, transforming them and refreshing Power BI Dashboards on a weekly cadence.
- A tool that leverages transactional and customer data to provide insights on the brand performance across channels and time periods.
Solution Delivered
- Built an automated streamlined process.
- Developed a data-optimized model to create a single source and increase performance.
- Built a Power BI dashboard based on provided UI design.
- Quality Process Optimization: Enhanced operational workflows and maintained consistent quality. ensured compliance with industry standards through rigorous quality control.
- Workload Reduction: Streamlined procedures and automated systems to reduce workload. achieved significant cost savings by minimizing rework and waste.
- Eliminated Human-Prone Errors: Implemented robust checks and automation to eliminate errors. increased accuracy and reliability, improving overall performance.
Business Impect
- Developed multiple Power BI reports to provide in-depth insights into transactional and customer data.
- Analyzed brand-level performance across categories, sales channels, and time periods.
- Reports offer comparative views of total market vs. brand performance, highlighting customer purchase behaviors.
- Key metrics include sales, customer count, purchase frequency, and spend per customer, with percentage changes.
- Sourced data from 700 Excel reports downloaded from the Luminate portal, containing segmented and time-based data.
- Enabled stakeholders to make data-driven decisions on brand strategies and market positioning.
- Provided clear, actionable insights into customer trends, helping to optimize resource allocation and enhance performance tracking.
Technology Stack
- Alteryx, Python, Selenium