- Text-to-Speech Gen AI Use Case: Enhancing Customer Experience with Dynamic Voice Interactions

Business Challenge/Problem Statement
- Inefficient Data Analysis: Manual transcription and analysis of voice data are slow, preventing timely insights into customer sentiment, operational inefficiencies, or market trends.
- Suboptimal Customer Service: Inability to quickly analyze customer calls for common issues, agent performance, or compliance risks leads to missed opportunities for service improvement and personalized support.
- Limited Accessibility and Searchability: Audio and video content without accurate transcripts are inaccessible to hearing-impaired individuals and difficult to search, hindering content discovery and utilization.
- Compliance and Regulatory Risks: In regulated industries, accurate and comprehensive records of voice communications are crucial for compliance, but manual processes or inaccurate STT can lead to gaps and risks.
- High Operational Costs: Relying on human transcribers for large volumes of audio data is expensive and does not scale efficiently with growing business needs.
Scope of Project
- High-Accuracy Transcription: Developing and training generative AI models to achieve state-of-the-art accuracy in transcribing spoken language, even in challenging conditions such as background noise, diverse accents, and rapid speech.
- Speaker Diarization: Implementing capabilities to accurately identify and separate individual speakers in a conversation, providing clear attribution for each transcribed segment.
- Natural Language Understanding (NLU) Integration: Integrating NLU capabilities to extract deeper meaning from transcribed text, including sentiment analysis, entity recognition, topic detection, and keyword extraction.
- Real-time and Batch Processing: Supporting both real-time transcription for live interactions (e.g., customer calls, virtual meetings) and efficient batch processing for large volumes of pre-recorded audio.
- Multi-language and Dialect Support: Expanding the system’s capabilities to accurately transcribe and understand multiple languages and regional dialects, ensuring global applicability.
- Customizable Acoustic and Language Models: Providing tools for clients to fine-tune acoustic models with their specific audio data and language models with industry-specific terminology, significantly improving accuracy for specialized use cases.
- API and SDK Development: Offering a comprehensive set of APIs and SDKs for seamless integration into existing enterprise applications, communication platforms, and data analytics tools.
- Scalability and Security: Designing the solution for high scalability to handle massive volumes of audio data and ensuring robust security measures to protect sensitive voice data and transcribed information.
- User Interface for Management and Analytics: Developing an intuitive user interface for managing transcription jobs, reviewing transcripts, and visualizing extracted insights and analytics.
Solution we Provided
- Superior Transcription Accuracy: Leveraging cutting-edge deep learning models, our STT engine delivers industry-leading accuracy, even in challenging audio environments. It excels at transcribing diverse accents, handling overlapping speech, and filtering out background noise, ensuring reliable conversion of spoken words into text.
- Intelligent Speaker Diarization: Our solution precisely identifies and separates individual speakers within a conversation, providing clear attribution for each segment of the transcript. This is crucial for understanding conversational flow, analyzing individual contributions, and improving the readability of multi-party dialogues.
- Advanced Natural Language Understanding (NLU): Beyond mere transcription, our system integrates powerful NLU capabilities. It automatically performs sentiment analysis to gauge emotional tone, extracts key entities (e.g., names, dates, products), identifies prevalent topics, and highlights critical keywords. This transforms raw text into structured, searchable, and insightful data.
- Flexible Processing Modes: We offer both real-time STT for immediate applications like live call transcription, virtual assistant interactions, and meeting minutes, as well as high-throughput batch processing for large archives of pre-recorded audio. This flexibility caters to diverse operational needs and workflows.
- Extensive Language and Dialect Support:Our models are trained on vast datasets covering numerous languages and their regional dialects, ensuring comprehensive global coverage and accurate transcription for a diverse user base. This enables businesses to serve international markets effectively.
- Customizable Models for Enhanced Performance: Clients can significantly improve transcription accuracy for their specific domain by fine-tuning our acoustic models with their proprietary audio data and adapting language models with industry-specific jargon, product names, and acronyms. This customization ensures optimal performance for specialized use cases like medical dictation or legal proceedings.
- Developer-Friendly API and SDKs: Our solution provides a robust, well-documented API and comprehensive SDKs (Software Development Kits) for seamless integration into existing applications. This allows developers to easily embed STT capabilities into CRM systems, communication platforms, analytics dashboards, and custom business applications.
- Scalable, Secure, and Compliant Architecture: Built on a cloud-native, microservices architecture, our solution is designed for massive scalability, capable of processing petabytes of audio data. We adhere to stringent security protocols and compliance standards (e.g., GDPR, HIPAA) to protect sensitive voice data and ensure data privacy.
- Intuitive Analytics Dashboard: A user-friendly web interface provides tools for managing transcription jobs, reviewing and editing transcripts, and visualizing NLU-derived insights through interactive dashboards. This empowers users to quickly gain actionable intelligence from their voice data.
Technical Architecture
- Machine Learning Frameworks:
- TensorFlow/PyTorch: Utilized for building and training advanced deep neural networks, including recurrent neural networks (RNNs), convolutional neural networks (CNNs), and Transformer models, which are essential for high-accuracy acoustic modeling and language understanding in STT systems.
- Cloud Infrastructure:
- Google Cloud Platform (GCP)/Amazon Web Services (AWS)/Microsoft Azure: Leveraging cloud-agnostic principles, the solution can be deployed on leading cloud providers. This provides access to scalable compute resources (GPUs/TPUs), object storage (e.g., S3, GCS), and managed services for databases and message queues, ensuring high availability, global reach, and elastic scalability.
- Programming Languages:
- Python: The primary language for AI/ML development, data processing, and backend services, chosen for its rich ecosystem of libraries (e.g., NumPy, Pandas, Scikit-learn) and frameworks for machine learning.
- Go/Java (for High-Performance Microservices): Used for building high-performance, low-latency microservices and API gateways that handle real-time audio streaming, transcription requests, and data orchestration.
- Database and Storage:
- NoSQL Databases (e.g., Cassandra, DynamoDB): For storing large volumes of unstructured and semi-structured data, such as audio metadata, transcription logs, and NLU-extracted insights, offering high scalability and flexibility.
- Object Storage (e.g., AWS S3, Google Cloud Storage): For efficient and cost-effective storage of raw audio files, processed audio, and large datasets used for model training.
- Containerization and Orchestration:
- Docker: For packaging the STT application and its dependencies into lightweight, portable containers, ensuring consistent deployment across development, testing, and production environments.
- Kubernetes: For orchestrating containerized applications, automating deployment, scaling, and management of the STT services, ensuring high availability and fault tolerance.
- API Management and Communication:
- RESTful APIs/gRPC: Providing secure, high-performance interfaces for client applications to interact with the STT engine, supporting both synchronous and asynchronous communication patterns.
- Kafka/RabbitMQ: For building robust, scalable message queues to handle real-time audio streams and asynchronous processing of large audio batches.
- Version Control and CI/CD:
- Git/GitHub/GitLab: For collaborative development, version control, and managing code repositories.
- Jenkins/GitHub Actions/GitLab CI/CD: For automated testing, continuous integration, and continuous deployment pipelines, ensuring rapid and reliable delivery of updates and new features.
- Monitoring and Logging:
- Prometheus/Grafana: For real-time monitoring of system performance, resource utilization, and service health, providing dashboards for operational insights.
- ELK Stack (Elasticsearch, Logstash, Kibana): For centralized logging, analysis, and visualization of system logs, aiding in troubleshooting, performance optimization, and security auditing.
- Text-to-SQL Gen AI Use Case: Empowering Business Users with Natural Language Database Access

Business Challenge/Problem Statement
- Delayed Insights: The dependency on technical teams creates a backlog of data requests, delaying access to critical information and slowing down decision-making processes.
- Limited Self-Service Analytics: Business users are unable to independently explore data, ask follow-up questions, or conduct iterative analysis, hindering agile business intelligence.
- Increased Workload for Technical Teams: IT and data teams are overwhelmed with routine data extraction tasks, diverting their focus from more strategic initiatives like data infrastructure development or advanced analytics.
- Underutilized Data Assets: The inability of non-technical users to directly interact with databases means that valuable data often remains untapped, limiting its potential to drive business value.
- Miscommunication and Misinterpretation: Translating business questions into technical SQL queries can lead to misunderstandings, resulting in incorrect data retrieval or irrelevant insights.
There is a critical need for a solution that democratizes data access, allowing non-technical users to query databases using natural language, thereby empowering them to gain immediate insights and make data-driven decisions without relying on intermediaries.
Scope of Project
This project aims to develop and implement a generative AI-powered Text-to-SQL system that enables users to query relational databases using natural language. The scope includes:
- Natural Language Understanding (NLU) for Query Interpretation: Developing advanced NLU models capable of accurately interpreting complex natural language questions, understanding user intent, and identifying relevant entities and relationships within the database schema.
- SQL Query Generation: Building a robust generative AI engine that translates interpreted natural language queries into syntactically correct and semantically accurate SQL queries, optimized for various database systems (e.g., MySQL, PostgreSQL, SQL Server, Oracle).
- Schema Linking and Metadata Management: Implementing mechanisms to automatically understand and link natural language terms to the underlying database schema (tables, columns, relationships) and manage metadata effectively to improve query generation accuracy.
- Contextual Understanding and Conversation History: Incorporating capabilities to maintain conversational context, allowing users to ask follow-up questions and refine queries iteratively without re-stating the entire request.
- Error Handling and Feedback Mechanism: Designing a system that can identify ambiguous or unanswerable queries, provide intelligent feedback to the user, and suggest clarifications or alternative phrasing.
- Security and Access Control: Ensuring that the Text-to-SQL solution adheres to strict security protocols, including user authentication, authorization, and data access policies, to prevent unauthorized data exposure.
- Integration with Existing Data Infrastructure: Providing flexible APIs and connectors for seamless integration with various enterprise data sources, business intelligence tools, and data visualization platforms.
- Performance Optimization: Optimizing the query generation process for speed and efficiency, ensuring that insights are delivered in near real-time, even for complex queries on large datasets.
- User Interface Development: Creating an intuitive and user-friendly interface (e.g., web application, chatbot integration) that facilitates natural language interaction with the database and presents query results clearly.
Solution we Provided
- Intuitive Natural Language Interface: Users can simply type their questions in plain English (or other supported natural languages), just as they would ask a human data analyst. Our system leverages advanced Natural Language Understanding (NLU) to accurately interpret user intent, identify key entities, and understand the relationships between data points.
- Intelligent SQL Generation: At the core of our solution is a sophisticated generative AI engine that translates natural language queries into highly optimized and semantically correct SQL statements. This engine is trained on vast datasets of natural language questions and corresponding SQL queries, enabling it to handle complex joins, aggregations, filtering, and sorting operations across various database schemas.
- Dynamic Schema Understanding and Linking: Our system dynamically analyzes the database schema, including table names, column names, data types, and relationships. It intelligently links natural language terms to the appropriate database elements, even for non-standard naming conventions, ensuring accurate query generation without manual mapping.
- Contextual Awareness and Conversational Flow: The solution maintains conversational context, allowing users to ask follow-up questions and refine their queries iteratively. For example, a user can ask “Show me sales for Q1,” and then follow up with “Now show me by region” without re-specifying the initial query parameters.
- Robust Error Handling and User Guidance: In cases of ambiguous or incomplete queries, our system provides intelligent feedback, suggesting clarifications or alternative phrasing to guide the user towards a successful query. This proactive assistance minimizes frustration and improves the user experience.
- Enterprise-Grade Security and Access Control: We integrate seamlessly with existing enterprise security frameworks, ensuring that users can only access data for which they have authorized permissions. All generated SQL queries are validated against predefined security policies before execution, safeguarding sensitive information.
- Seamless Integration and Extensibility: Our solution offers flexible APIs and connectors, allowing for easy integration with existing data ecosystems, including business intelligence dashboards, data visualization tools, enterprise applications, and popular chat platforms. This ensures that data insights are accessible where and when they are needed.
- High Performance and Scalability: Designed for enterprise environments, our Text-to-SQL engine is optimized for speed and efficiency, capable of generating and executing complex queries on large datasets in near real-time. Its scalable architecture can handle a growing number of users and increasing data volumes without compromising performance.
- Auditability and Transparency: For compliance and debugging purposes, our system provides full audit trails of natural language queries, generated SQL, and query results, ensuring transparency and accountability in data access.
Technology Enviornment
Our generative AI Text-to-SQL solution is built upon a robust and scalable technology stack, designed for high performance, accuracy, and seamless integration into diverse enterprise data environments. The core components and technologies include:
- Machine Learning Frameworks:
- TensorFlow/PyTorch: Utilized for building and training advanced deep learning models, particularly large language models (LLMs) and transformer-based architectures, which are fundamental for Natural Language Understanding (NLU) and SQL generation.
- Cloud Infrastructure:
- Google Cloud Platform (GCP)/Amazon Web Services (AWS)/Microsoft Azure: Leveraging cloud-agnostic principles, the solution can be deployed on leading cloud providers. This provides access to scalable compute resources (GPUs/TPUs), managed database services, and object storage, ensuring high availability, global reach, and elastic scalability.
- Programming Languages:
- Python: The primary language for AI/ML development, NLU processing, and backend services, chosen for its extensive libraries (e.g., Hugging Face Transformers, SpaCy) and frameworks for machine learning and data manipulation.
- Java/Go (for High-Performance API and Data Connectors): Used for building high-performance, low-latency API gateways and data connectors that interact with various database systems and orchestrate query execution.
- Database Connectivity and Management:
- SQLAlchemy/JDBC/ODBC: For establishing secure and efficient connections to a wide range of relational database management systems (RDBMS) like MySQL, PostgreSQL, SQL Server, Oracle, and Snowflake.
- Metadata Stores (e.g., Apache Atlas, Custom Solutions): For managing and storing database schema information, table and column descriptions, and data lineage, crucial for accurate schema linking and contextual understanding.
- Containerization and Orchestration:
- Docker: For packaging the Text-to-SQL application and its dependencies into portable containers, ensuring consistent deployment across different environments.
- Kubernetes: For orchestrating containerized applications, automating deployment, scaling, and management of the Text-to-SQL services, ensuring high availability and fault tolerance.
- API Management and Communication:
- RESTful APIs/gRPC: Providing secure, high-performance interfaces for client applications to submit natural language queries and receive SQL results and data insights.
- Message Queues (e.g., Apache Kafka, RabbitMQ): For asynchronous processing of complex queries, managing query queues, and enabling real-time data streaming for analytics.
- Version Control and CI/CD:
- Git/GitHub/GitLab: For collaborative development, version control, and managing code repositories.
- Jenkins/GitHub Actions/GitLab CI/CD: For automated testing, continuous integration, and continuous deployment pipelines, ensuring rapid and reliable delivery of updates and new features.
- Monitoring and Logging:
- Prometheus/Grafana: For real-time monitoring of system performance, query execution times, and resource utilization.
- ELK Stack (Elasticsearch, Logstash, Kibana): For centralized logging, analysis, and visualization of system logs, aiding in troubleshooting, performance optimization, and security auditing.
This robust technology environment ensures that our generative AI Text-to-SQL solution is not only powerful and accurate but also highly scalable, secure, and easily maintainable, capable of meeting the demanding requirements of various enterprise data analytics needs.
- Text-to-Speech Gen AI Use Case: Enhancing Customer Experience with Dynamic Voice Interactions
Business Challenge/Problem Statement
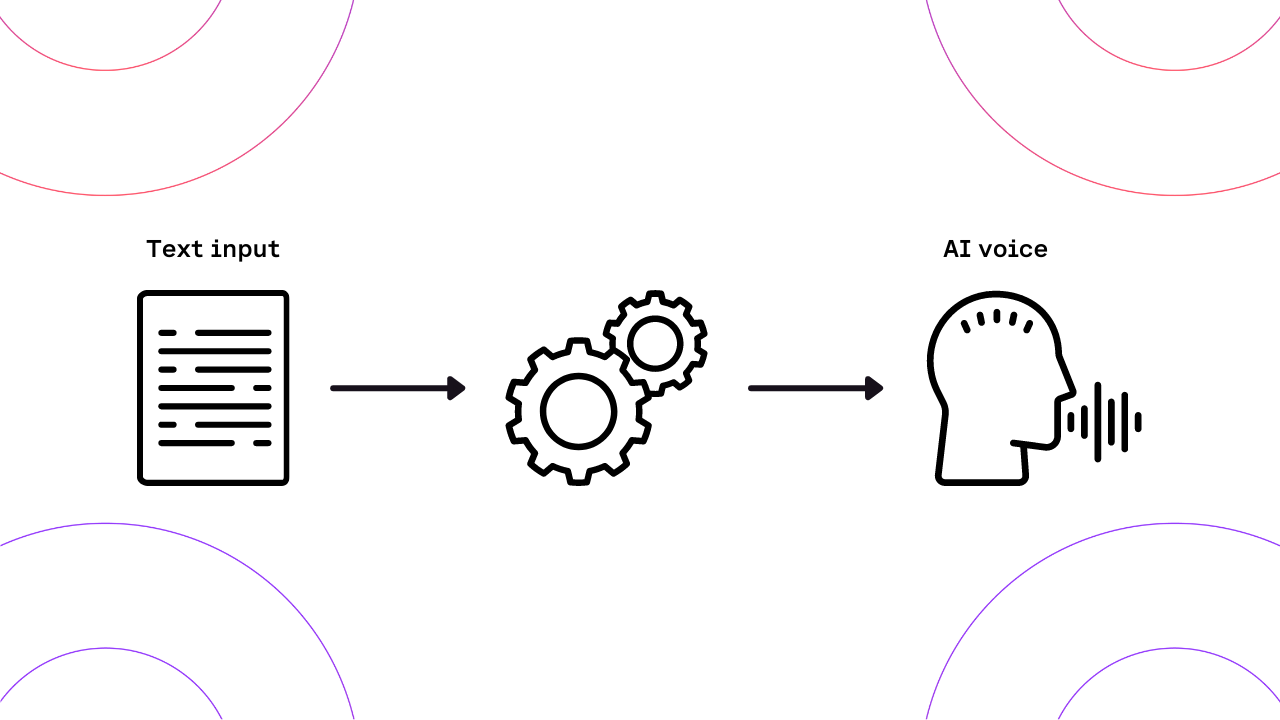
Traditional text-to-speech (TTS) solutions often suffer from robotic, unnatural-sounding voices, lacking the intonation, emotion, and nuance required for engaging human-like interactions. This limitation significantly impacts customer experience in various sectors, including customer support, e-learning, content creation, and accessibility services. Businesses struggle to deliver personalized and empathetic voice interactions at scale, leading to:
- Poor Customer Engagement: Monotonous voices can disengage customers, leading to frustration and reduced satisfaction in automated systems.
- Limited Brand Representation: Brands find it challenging to convey their unique tone and personality through generic, synthetic voices.
- Inefficient Content Production: Creating high-quality audio content for e-learning modules, audiobooks, or marketing materials is often time-consuming and expensive, requiring professional voice actors.
- Accessibility Barriers: While TTS aids accessibility, unnatural voices can still pose comprehension challenges for users with cognitive disabilities or those who rely heavily on auditory information.
There is a clear need for a next-generation TTS solution that leverages generative AI to produce highly natural, emotionally intelligent, and customizable voices, capable of transforming digital interactions into rich, human-like experiences.
Scope of The Project
This project aims to develop and implement an advanced text-to-speech (TTS) system powered by generative AI, specifically designed to overcome the limitations of traditional TTS. The scope includes:
- Development of a Custom Voice Model: Training a generative AI model on a diverse dataset of human speech to create a highly natural and expressive voice. This model will be capable of generating speech with appropriate intonation, rhythm, and emotional nuances.
- Emotion and Tone Recognition: Integrating capabilities to detect and interpret emotional cues from input text, allowing the TTS system to generate speech that matches the intended sentiment (e.g., happy, sad, urgent).
- Multi-language and Accent Support: Expanding the system’s capabilities to support multiple languages and regional accents, ensuring global applicability and localized user experiences.
- API Integration: Providing a robust and easy-to-integrate API for seamless adoption across various platforms and applications, including customer service chatbots, virtual assistants, e-learning platforms, and content management systems.
- Scalability and Performance Optimization: Ensuring the solution is highly scalable to handle large volumes of text-to-speech conversions in real-time, with optimized performance for low-latency applications.
- User Customization: Allowing users to fine-tune voice parameters such as pitch, speaking rate, and emphasis, and potentially create unique brand voices.
- Ethical AI Considerations: Implementing safeguards to prevent misuse and ensure responsible deployment of the generative AI TTS technology, including addressing concerns around deepfakes and voice cloning.
Solution We Provided
Our generative AI-powered text-to-speech solution addresses the identified challenges by offering a sophisticated platform that transforms text into highly natural and emotionally rich spoken audio. Key features of our solution include:
- Human-like Voice Synthesis: Leveraging advanced neural networks and deep learning models, our system generates speech that closely mimics human intonation, rhythm, and pronunciation, significantly reducing the ‘robotic’ sound often associated with traditional TTS.
- Emotional Intelligence: The solution incorporates a sophisticated emotion recognition engine that analyzes the sentiment of the input text. This allows the AI to dynamically adjust the voice’s tone, pitch, and speaking style to convey appropriate emotions, such as empathy, excitement, or urgency, making interactions more engaging and relatable.
- Voice Customization and Branding: Clients can choose from a diverse library of pre-trained voices or work with us to create a unique brand voice. This includes fine-tuning parameters like accent, gender, age, and speaking pace, ensuring consistency with brand identity across all voice interactions.
- Multi-lingual and Multi-accent Support: Our solution supports a wide range of languages and regional accents, enabling businesses to cater to a global audience with localized and culturally appropriate voice content. This is crucial for international customer support, e-learning, and content distribution.
- Real-time Processing and Scalability: Engineered for high performance, the system can convert large volumes of text to speech in real-time, making it suitable for dynamic applications like live customer service calls, interactive voice response (IVR) systems, and real-time content generation. Its scalable architecture ensures consistent performance even during peak demand.
- Seamless API Integration: We provide a well-documented and easy-to-use API that allows for straightforward integration into existing applications and workflows. This includes web applications, mobile apps, content management systems, and enterprise software, minimizing development overhead for clients.
- Content Creation Efficiency: By automating the voiceover process with high-quality, natural-sounding voices, our solution drastically reduces the time and cost associated with producing audio content for e-learning modules, audiobooks, podcasts, marketing campaigns, and accessibility features.
- Ethical and Responsible AI: We prioritize ethical AI development, implementing robust measures to prevent misuse of voice synthesis technology. This includes watermarking generated audio and providing tools for content authentication, addressing concerns related to deepfakes and ensuring responsible deployment.
Technical Architecture
- Machine Learning Frameworks:
- TensorFlow/PyTorch: Utilized for building and training deep neural networks, particularly for advanced generative models like WaveNet, Tacotron, and Transformer-based architectures, which are fundamental to natural-sounding speech synthesis.
- Cloud Infrastructure:
- Google Cloud Platform (GCP)/Amazon Web Services (AWS)/Microsoft Azure: Leveraging cloud-agnostic principles, the solution can be deployed on leading cloud providers for scalable compute resources (GPUs/TPUs), storage, and managed services. This ensures high availability, global reach, and elastic scalability to handle varying workloads.
- Programming Languages:
- Python: The primary language for AI/ML development, data processing, and API backend services, due to its extensive libraries and frameworks for machine learning.
- Node.js/Go (for API Gateway/Microservices): Used for building high-performance, low-latency API gateways and microservices that handle requests and orchestrate interactions between different components of the TTS system.
- Database and Storage:
- NoSQL Databases (e.g., MongoDB, Cassandra): For storing large volumes of unstructured data, such as audio samples, voice models, and metadata, offering flexibility and scalability.
- Object Storage (e.g., Google Cloud Storage, AWS S3): For efficient and cost-effective storage of large audio datasets and generated speech files.
- Containerization and Orchestration:
- Docker: For packaging applications and their dependencies into portable containers, ensuring consistent deployment across different environments.
- Kubernetes: For orchestrating containerized applications, managing deployments, scaling, and ensuring high availability of the TTS services.
- API Management:
- RESTful APIs/gRPC: Providing well-defined interfaces for seamless integration with client applications, ensuring secure and efficient communication.
- Version Control and CI/CD:
- Git/GitHub/GitLab: For collaborative development, version control, and managing code repositories.
- Jenkins/GitHub Actions/GitLab CI/CD: For automated testing, building, and deployment pipelines, ensuring rapid and reliable delivery of updates and new features.
- Monitoring and Logging:
- Prometheus/Grafana: For real-time monitoring of system performance, resource utilization, and service health.
- ELK Stack (Elasticsearch, Logstash, Kibana): For centralized logging, analysis, and visualization of system logs, aiding in troubleshooting and performance optimization.
- Autonomous Agentic AI for Scientific Discovery

The Challenge
Traditional scientific research and drug discovery processes are slow, resource-intensive, and prone to human bias. Researchers often face bottlenecks due to:
- Manual literature review of vast scientific databases.
- Cognitive bias that limits exploration of unconventional hypotheses.
- High time and cost associated with hypothesis testing and simulations.
- Lack of scalability, as human researchers cannot operate continuously at large scale.
The goal was to design an autonomous, intelligent agent system capable of managing the entire R&D lifecycle—from hypothesis generation to experiment design, analysis, and recommendation—dramatically accelerating innovation.
Scope of Project
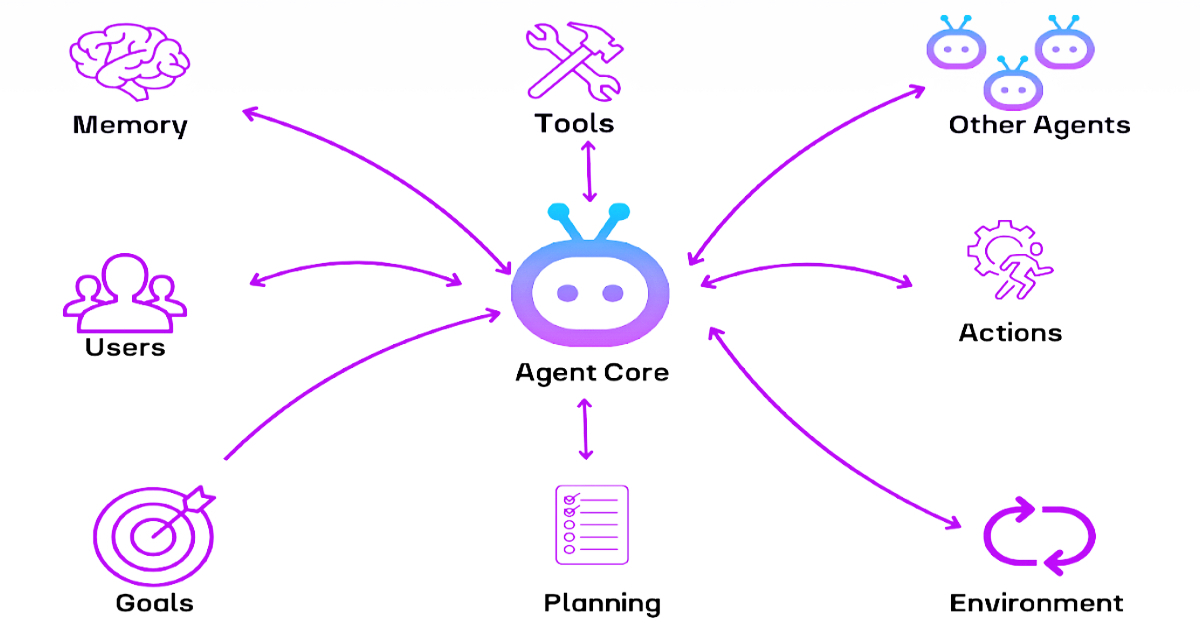
Solution: Agentic AI Workflow
- Task Decomposition & Planning (Project Manager Agent)
- Interprets high-level research goals and breaks them into structured tasks.
- Plans workflows covering literature review, hypothesis generation, simulations, and result analysis.
-
Information Gathering & Synthesis (Research Assistant Agent)
- Crawls and queries scientific databases (PubMed, arXiv, patents).
- Summarizes findings and compiles a state-of-the-art knowledge base.
-
Hypothesis Generation & Experiment Design (Scientist Agent)
- Formulates testable hypotheses.
- Designs in-silico experiments, writing and executing simulation code on cloud-based HPC infrastructure.
- Analysis, Learning, & Iteration (Lead Analyst Agent)
- Analyzes simulation results and identifies promising candidates.
- Employs agentic reasoning to refine hypotheses, optimize parameters, and rerun experiments.
-
Reporting & Recommendation (Communicator Agent)
- Generates a comprehensive scientific report detailing methods, findings, and confidence scores.
- Provides actionable insights to human researchers for lab validation.
The deployment of an Agentic AI-driven R&D platform revolutionized scientific discovery workflows. By automating the entire research pipeline—data collection, hypothesis generation, simulation, and analysis—the solution significantly accelerated drug discovery and innovation while reducing cost and human error.
Business Impact
Impact Area | Results Achieved |
Time-to-Discovery | Reduced early-stage R&D timelines from years to weeks or days, accelerating go-to-market strategy. |
Cost Optimization | Decreased manual research and simulation costs by 40–60% through automation. |
Exploration of Novel Solutions | Identified non-obvious, high-potential compounds by overcoming human cognitive bias. |
Scalability | Enabled 24/7 autonomous research, continuously iterating on hypotheses without downtime. |
Reproducibility & Transparency | Maintained a fully documented digital record of every research step for auditing and replication. |
Innovation Enablement | Provided scientists with validated, AI-driven recommendations, freeing them to focus on creative problem-solving. |
Technical Architecture
- Core AI Techniques: Multi-agent systems, agentic reasoning, natural language processing, reinforcement learning.
- Scientific Tools: Protein structure prediction models (e.g., AlphaFold 3), molecular docking simulations.
- Infrastructure: Cloud-based HPC for large-scale simulations and analytics.
- Case Study – End-to-End Automated Supply Chain Resolution Agent
The Challenge
Global supply chains are increasingly complex and vulnerable to disruptions caused by weather events, geopolitical tensions, port congestion, transportation delays, and supplier issues. Traditional supply chain management systems are often reactive, providing alerts but requiring human intervention for problem-solving. This leads to:
- High downtime costs due to delayed shipments or factory shutdowns.
- Siloed decision-making without optimization across the entire supply chain.
- Slow response times, resulting in lost revenue and reduced customer satisfaction.
- Limited scalability as human teams cannot handle disruptions at global scale in real-time.
The goal was to build an autonomous AI-driven system capable of diagnosing, planning, and resolving supply chain disruptions end-to-end without human intervention, ensuring resilience and agility.
Scope of Project
To create an Agentic AI solution that acts as a digital supply chain manager, autonomously monitoring shipments, evaluating contingency plans, and executing resolutions in real time—while proactively communicating with all stakeholders.
sOLUTION
To create an Agentic AI solution that acts as a digital supply chain manager, autonomously monitoring shipments, evaluating contingency plans, and executing resolutions in real time—while proactively communicating with all stakeholders.
Solution: Agentic AI Supply Chain Workflow
- Continuous Monitoring & Diagnosis (Sentinel Agent)
- Constantly monitors IoT sensor data, weather forecasts, port congestion databases, ERP inventory levels, and shipping carrier updates.
- Detects disruptions (e.g., delayed shipments, material shortages, or unexpected factory downtimes).
- Strategic Planning & Evaluation (Strategist Agent)
- Generates multiple response scenarios (rerouting shipments, sourcing alternatives, rescheduling production).
- Evaluates solutions against cost, time-to-resolution, production schedules, and downstream customer impact.
- Autonomous Execution & Negotiation (Executor Agent)
- Executes the chosen plan autonomously:
- Places purchase orders with alternate suppliers.
- Reroutes shipments via logistics carriers.
- Updates ERP and production systems in real time.
- Executes the chosen plan autonomously:
- Proactive Communication & Stakeholder Management (Coordinator Agent)Notifies
- relevant teams with clear, actionable updates:
- Factory managers receive updated production timelines.
- Procurement teams receive cost approvals.
- Customers receive proactive delivery updates.
- relevant teams with clear, actionable updates:
Business Impact
The Automated Supply Chain Resolution Agent transformed traditional supply chain operations from reactive firefighting to proactive resilience management. By autonomously detecting disruptions, strategizing contingency plans, and executing actions, it empowered enterprises to maintain uninterrupted production, reduce losses, and enhance customer confidence.
Impact Area | Results Achieved |
Disruption Resolution Speed | Reduced time to resolve disruptions from days to minutes or hours, ensuring uninterrupted production. |
Cost Optimization | Lowered operational losses by 40–50% through proactive adjustments and risk-based decision-making. |
Production Continuity | Eliminated costly downtime, safeguarding millions in potential revenue loss per incident. |
Customer Satisfaction | Improved on-time delivery rates by 30–40%, driving better customer trust and retention. |
Scalability | Managed thousands of shipments and events simultaneously without increasing workforce. |
Continuous Improvement | Learned from historical disruptions, improving response quality over time. |
Technical Architecture
- AI Capabilities: Agentic reasoning, reinforcement learning, NLP-driven communication.
- Data Integration: IoT sensors, weather APIs, logistics platforms, ERP systems.
- Automation Layer: Robotic process automation (RPA) and API-based system integrations.
- Case Study: : Cognitive AI for Intelligent and Empathetic Customer Support

Industry : Customer Service & Technology
Challanges
- Traditional chatbots lacked emotional intelligence and context awareness, leading to frustrating user experiences.
- Resolving complex, multi-step technical issues required frequent escalation to human agents, slowing resolution times.
- High operational costs due to the need for large customer support teams to handle intricate cases.
- Lack of proactive issue detection, resulting in delayed responses to widespread problems.
- Disconnected customer experience due to limited memory of prior interactions, causing repetitive queries and reduced satisfaction.
Scope of The Project
- Deploy Cognitive AI agents capable of understanding customer intent, context, and emotion.
- Enable multi-turn, stateful conversations for resolving complex customer issues end-to-end without human intervention.
- Automate diagnostic workflows, software updates, and issue resolution through agentic reasoning.
- Continuously improve system intelligence by learning from every customer interaction.
- Build a proactive support system to detect and mitigate issues before customers escalate them.
Solution We Provided
- Implemented a Cognitive AI-powered customer support platform with the following key features:
- Advanced NLP & Emotional Intelligence: Ability to detect urgency, frustration, and intent, allowing AI agents to respond empathetically.
- Agentic Reasoning Module: AI autonomously diagnoses technical issues, executes multi-step solutions (e.g., firmware updates), and validates resolutions.
- Stateful Contextual Memory: Retains conversation history and past interactions, ensuring smooth and personalized responses.
- Continuous Learning: AI improves its knowledge base in real-time, optimizing performance and reducing repetitive issues.
- Proactive Issue Detection: The system identifies patterns in isolated cases and alerts teams about potential large-scale problems
Business Impact
- Enhanced Customer Experience:
- Provided 24/7 empathetic and hyper-personalized support, leading to a significant rise in CSAT (Customer Satisfaction) scores and brand loyalty.
- Automated 30-50% of complex support tickets, reducing dependency on human agents and cutting operational costs.
- Reduced response and resolution times significantly, improving SLAs and enabling faster troubleshooting.
- Handled growing customer volumes without increasing headcount, making support operations future-ready.
- Early detection of widespread technical issues prevented high call volumes and improved brand trust.
Technology Stack
- Natural Language Processing (NLP): Advanced parsing for sentiment and intent detection.
- Machine Learning & Cognitive AI Models: For reasoning, continuous learning, and decision-making.
- Agentic AI Frameworks: Enables autonomous execution of workflows and diagnostics.
- Cloud Infrastructure: For scalable and secure AI deployment.
- Integration Layer: APIs for connecting customer support platforms, CRM systems, and IoT device diagnostics. .
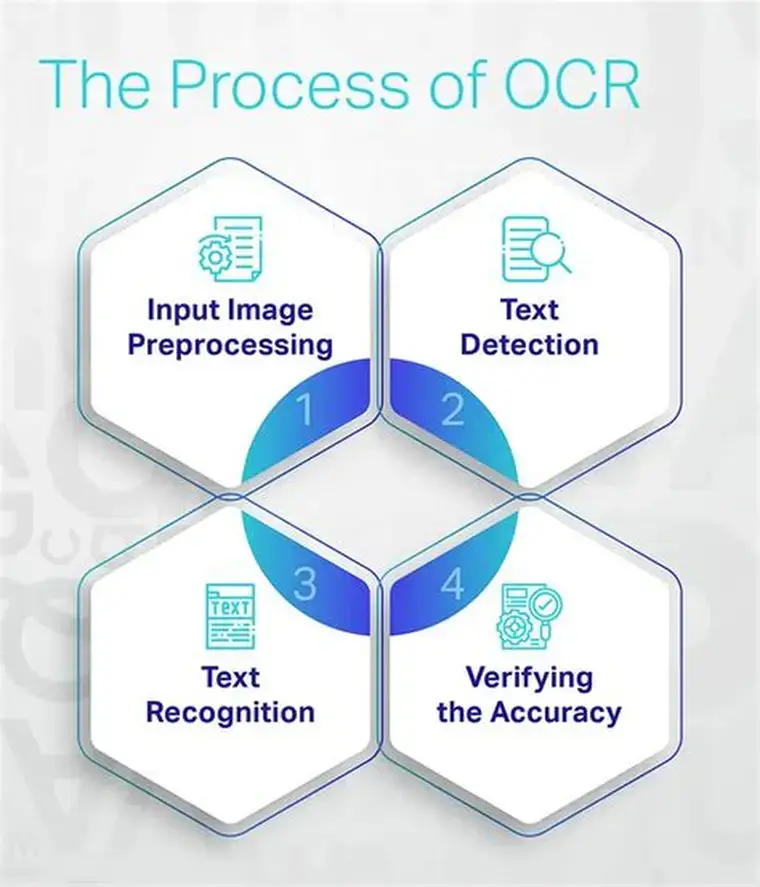
- Automating Invoice Processing with OCR

Industry
Challenges
Document Variability: Invoices from hundreds of vendors had inconsistent layouts and terminologies, making automation difficult.
Low-Quality Scans & Images: Poor-quality scanned invoices required preprocessing to achieve high OCR accuracy.
- Handwriting Recognition: Occasional handwritten fields needed additional verification workflows.
- Integration Complexity: Synchronizing extracted data with multiple ERP and procurement platforms was challenging.
- Change Management: Finance teams needed training to adapt to the automated process.
Scope of The Project
- Standardize invoice processing for multiple vendors.
- Integrate automation with ERP and accounting systems.
- Reduce processing time, errors, and costs while improving cash flow visibility.
Business Impact
| KPI | Before OCR Implementation | After OCR Implementation | Improvement |
| Processing Time per Invoice | 5-15 mins | < 30 seconds | ~90% faster |
| Error Rate | 15-20% | < 2% | ~88% reduction |
| Straight-Through Processing | <10% | 60-80% | Significant |
| Cost per Invoice | High (manual labor) | 50-70% lower | Major savings |
| Annual Labor Hours Saved | N/A | ~2,500 hours (for 50,000 invoices/year) | Operational efficiency boost |
- Faster Payment Cycles led to early payment discounts and improved supplier relationships.
- Cash Flow Predictability improved due to real-time invoice visibility.
- Finance Teams could focus on strategic work rather than data entry.
Technology Environment
Technology | Purpose |
OCR Engines (Tesseract, Roboflow OCR API) | Core text recognition |
AI Models (LayoutLMv3, GPT-4o) | Contextual understanding, multimodal field detection |
Computer Vision Object Detection | Field and table localization |
ERP/Accounting Systems (SAP, Oracle, QuickBooks, etc.) | Data integration |
APIs & Middleware | Automated workflows and validation |
Preprocessing Tools (OpenCV) | Image enhancement and quality improvement |
- Dashboard-realtime insights
Industry
Challanges
Scope of the Project
- Migrating reporting from Excel to Tableau using the Infinity data source.
- Building a Master Production Schedule (MPS) Dashboard to monitor inventory and supply chain metrics.
- Offering historical, summary, and Weeks of Supply (WOS) views at multiple hierarchy levels (item, location, and region).
- Ensuring data integrity and real-time updates to improve decision-making.
Solution Provided
- Data Preparation and Processing:
Raw data from multiple systems was integrated through the Infinity platform and processed using Alteryx. Existing macros were enhanced with new formulas to clean, transform, and standardize the data at item, location, and region levels. This created a reliable foundation for accurate reporting. - Master Production Schedule (MPS) Output:
The processed data was used to generate a detailed MPS output, which included metrics such as Weeks of Supply (WOS), backorders, calculated on-hand inventory, deploy-in/out movements, plan orders, and safety stock levels. - Interactive Tableau Dashboards:
The MPS output was visualized in Tableau, with dashboards designed to provide historical views, summary reports, and WOS analysis. Drill-down capabilities allowed users to analyze performance at granular levels, such as by warehouse, product line, or region. - Automation and Real-Time Insights:
Automated workflows in Alteryx and Tableau ensured weekly updates with minimal manual intervention. This provided near real-time visibility into stock levels, demand, and supply chain risks. - Actionable Analytics:
The dashboards enabled supply chain teams to quickly identify inefficiencies, manage stock movements, and balance inventory across locations. Early warnings for potential stockouts or overstock situations allowed timely corrective actions.
Business Impact
- Improved Efficiency: Automated updates significantly reduced manual effort, freeing teams to focus on strategic planning rather than data preparation.
- Real-Time Visibility: Managers could monitor inventory, backorders, and WOS across all locations with up-to-date insights.
- Risk Reduction: Proactive identification of supply-demand imbalances minimized the risk of stockouts and excess inventory.
- Faster Decision-Making: Interactive dashboards and drill-down analysis enabled leaders to act quickly and confidently.
- Scalability: The solution established a foundation that could easily adapt to growing data volumes and additional KPIs.
Technical Architecture
- Data source: Infinity (inventory and supply chain systems).
- Data Processing & ETL: Alteryx (data cleaning, transformation, aggregation, macros, and formula enhancements)
- Visualization & Reporting: Tableau (MPS dashboards, historical views, summary views, WOS analysis)
- Automation: Scheduled workflows and automated data refreshes in Alteryx and Tableau
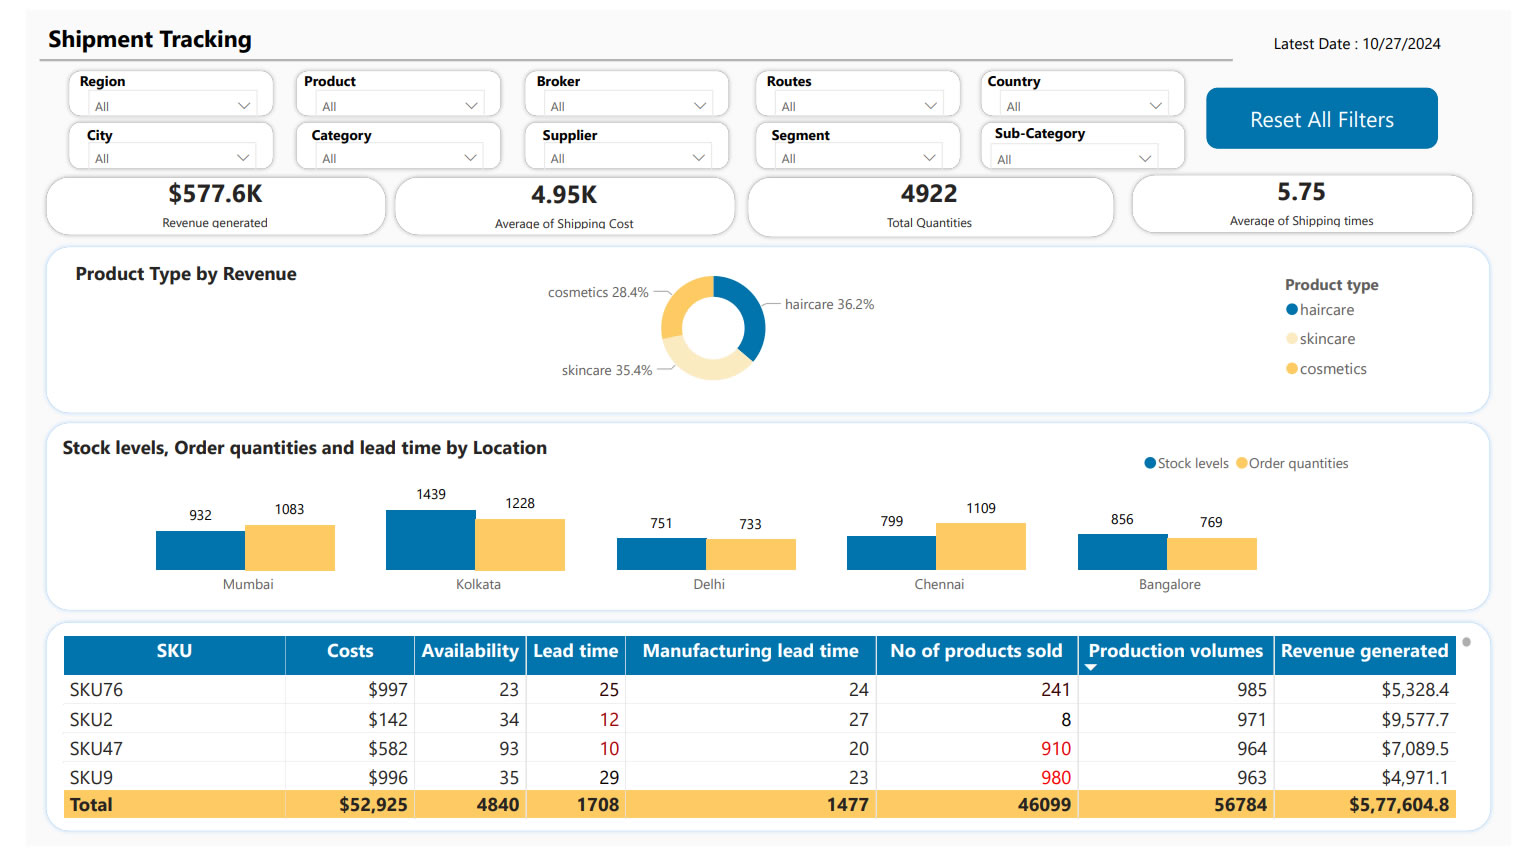
- Shipment Tracking
Challanges
Key challenges included:
- Stockouts of fast-moving products, resulting in missed sales opportunities.
- Overstocking of slow-moving items, leading to high storage costs and waste.
- Supplier delays and logistics bottlenecks, which increased shipping costs and eroded customer satisfaction.
- High defect rates, damaging brand reputation.
- Fragmented and manual processes, with reliance on Tableau server exports, Excel mapping, and pivot table analysis—limiting the ability to scale, automate, and provide timely insights.
- Poor demand forecasting caused by inconsistent data, delaying critical business decisions.
Scope of Project
- Consolidating shipment data from multiple sources into a single, automated reporting system.
- Providing visibility into order fulfillment, supplier performance, delivery timelines, and product movement.
- Implementing automated alerts for stockouts and overstock conditions.
- Empowering decision-makers with real-time, drill-down insights into product sales trends, partner performance, and logistics efficiency.
Solution Provided
A comprehensive Shipment Tracking Dashboard was developed in Power BI, supported by an automated ETL and data integration pipeline.
- Data Integration & Automation
Data was ingested from multiple sources, including Nielsen, SharePoint, and Excel files. Alteryx and Python scripts were used to automate extraction, transformation, and loading (ETL) processes. A dedicated database (Snowflake) was created to store cleaned and structured shipment data, removing dependency on manual Excel exports. - Data Preparation & Transformation
Using Alteryx workflows, the manual Excel and pivot-table-based process was eliminated. Data was cleansed, standardized, and mapped to common dimensions (product hierarchy, suppliers, time, and regions). DAX modeling in Power BI enabled creation of calculated metrics for shipment value, lead times, and stock movement. - Power BI Dashboard Development
The dashboard provided stakeholders with:- A time-period comparison of total shipment value.
- Drill-down capabilities to analyze performance at product, sub-brand, or supplier level.
- Insights into shipment delays, supplier performance, and defect rates.
- Automated alerts and KPIs for stockouts, overstock risks, and fulfillment gaps.
- Real-Time Monitoring & Alerts
The dashboards refreshed automatically on a daily/weekly basis, giving near real-time visibility. Notifications highlighted underperforming suppliers, late deliveries, and shipment anomalies, enabling proactive decision-making. - Scalable Architecture
The solution was designed for scalability with additional geographies, suppliers, and KPIs. SharePoint was integrated to host files that change based on availability, ensuring seamless updates without manual intervention.
This end-to-end automation transformed shipment analysis from a reactive, Excel-based process into a proactive, real-time system.
Business Impact
- Reduced Manual Effort: Automation removed dependency on manual Excel mapping and pivot tables, cutting reporting time significantly.
- Improved Visibility: Stakeholders gained access to a unified view of shipments across suppliers, regions, and product lines.
- Operational Efficiency: Early detection of stockouts, overstock, and supplier delays improved inventory balance and reduced costs.
- Faster Decision-Making: Interactive dashboards enabled managers to drill down to granular details and respond quickly.
- Enhanced Customer Satisfaction: Timely shipments and fewer disruptions improved service reliability and brand trust.
- Scalable Insights: The architecture allowed easy expansion to more datasets, ensuring long-term sustainability.
Technology Stack
- Data Sources: Nielsen, SharePoint, Excel, Supplier Data
- ETL & Data Processing: Alteryx, Python, Snowflake
- Visualization & Analytics: Power BI Desktop & Power BI Services (DAX modeling, interactive dashboards, automated alerts)
- Collaboration & Automation: SharePoint for file hosting, Power BI Services for secure sharing and role-based access
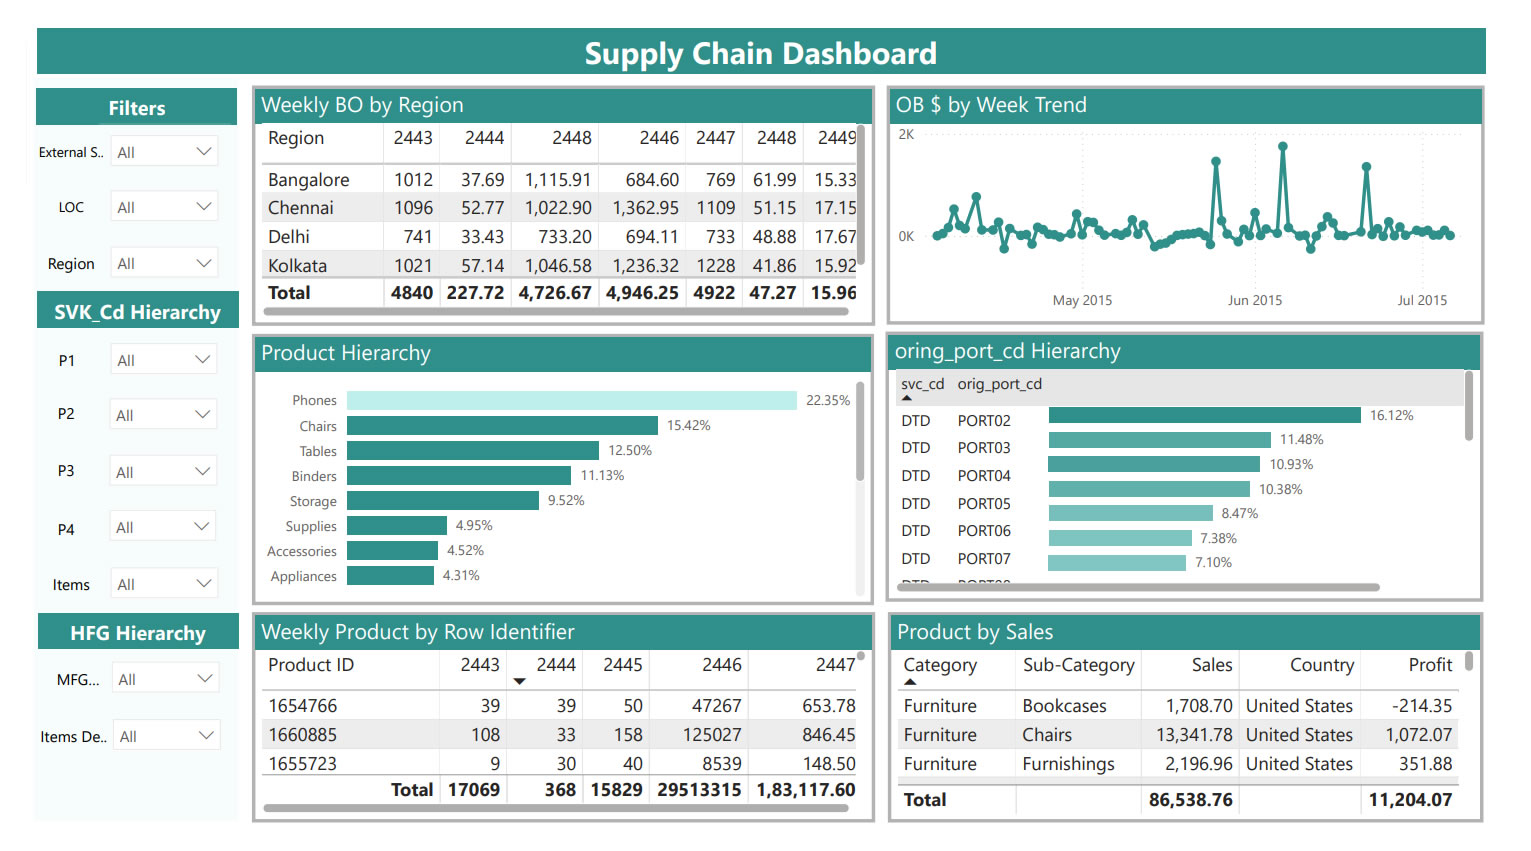
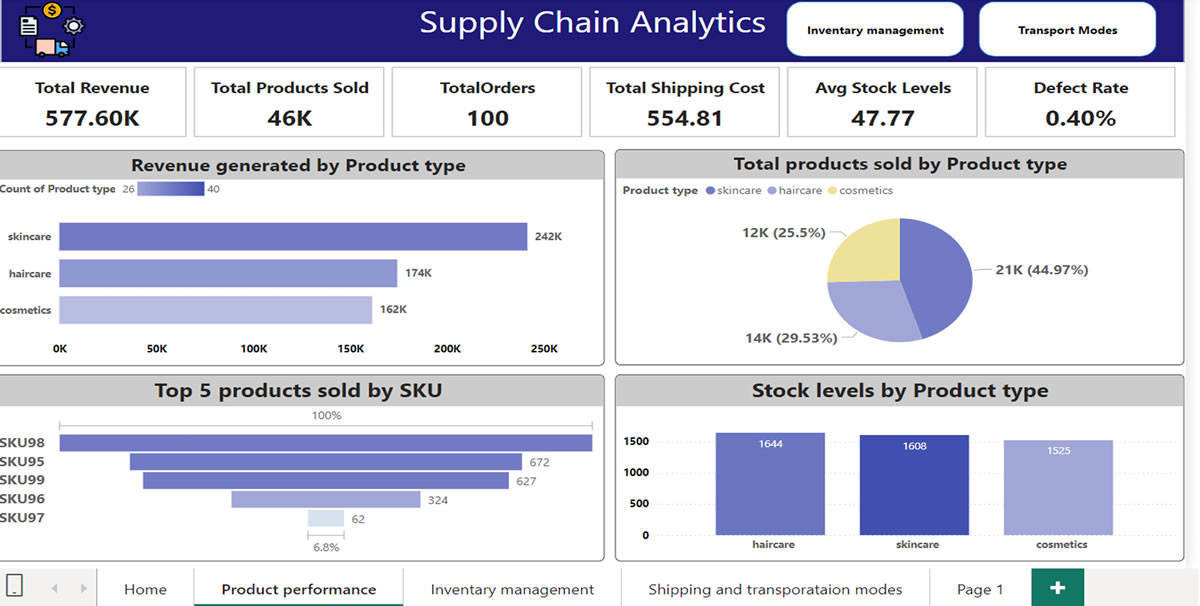
- Supply Chain Analytics
Challanges
Scope of Project
Scope of Project
- Inventory Optimization: Automated alerts were implemented for both low stock levels and excess inventory, ensuring timely replenishment and avoiding unnecessary overstocking.
- Supplier Performance Management: Dashboards tracked supplier lead times and order fulfillment rates, enabling the identification of reliable partners and quick action against underperforming suppliers.
- Logistics & Shipping Efficiency: Analytics were used to monitor shipping costs and optimize delivery routes. Real-time tracking of delivery times helped reduce delays and improve on-time fulfillment.
- Quality Control Monitoring: Dashboards monitored defect rates and inspection results, allowing the business to identify recurring issues and reduce returns.
- Predictive Insights: Sales trends and demand forecasting models provided better planning capability, helping to align production with actual consumer demand.
Business Impact
- Reduced Stockouts and Excess Inventory, improving product availability while lowering carrying costs.
- Improved Supplier Relationships through data-backed performance evaluations and stronger delivery reliability.
- Optimized Logistics Costs by reducing shipping inefficiencies and minimizing delays.
- Enhanced Product Quality with better defect tracking, leading to fewer returns and stronger brand reputation.
- Greater Customer Satisfaction driven by reliable product availability and faster, more efficient delivery.
Technology stack
- Data Integration & Preparation: SQL, Excel
- Visualization & Dashboards: Power BI / Tableau
- Data Analytics & Forecasting: Statistical models for demand forecasting and supplier performance analysis
- Automation: Alerts and notifications for inventory and supplier KPIs
- Supply Chain -Procurement
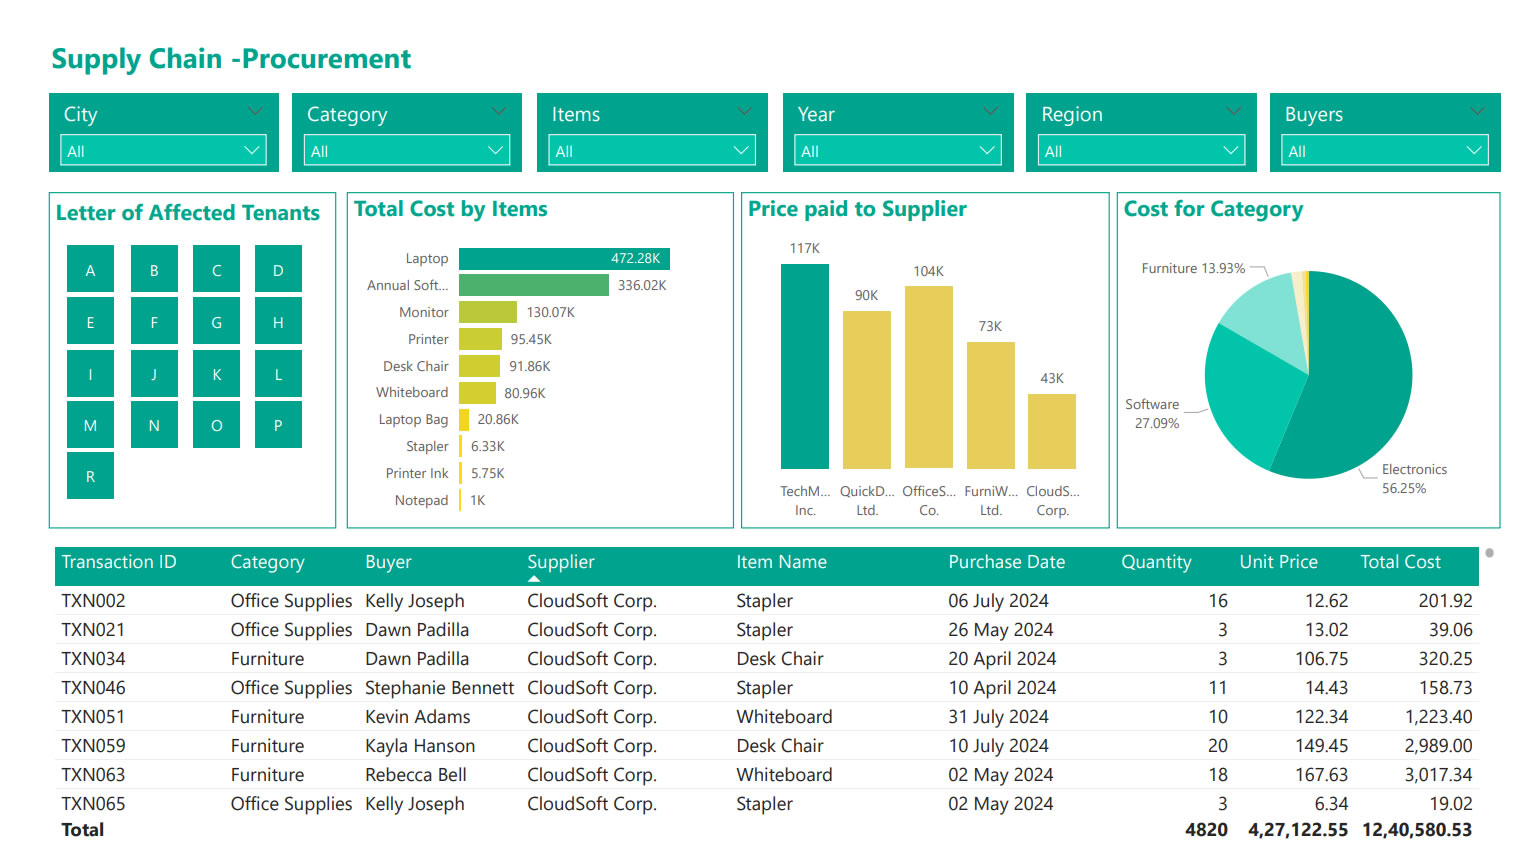
The Challenge
- Lack of unified reporting and performance visibility across procurement operations.
- Manual preparation of reports caused delays in delivering actionable insights to senior management.
- Difficulty in consolidating and validating data across departments to ensure consistency.
- Limited visualization tools and lack of interactivity in reports.
Executive Summary
Scope of Project
- Track procurement process efficiency and performance metrics.
- Automate the generation of daily, weekly, monthly, and quarterly reports.
- Enable senior management to make informed business decisions through interactive dashboards.
Solution
-
Data Analysis & Visualization
-
Used Tableau to design multiple visualization types:
- Dual Axis Charts, Combo Charts, Pie & Bar Charts, Geographic & Heat Maps, Small Multiples.
- Implemented drill-through reports, hierarchies, and quick filters to enhance interactivity.
- Created calculated fields, parameters, and custom labels for precision in reporting.
-
Used Tableau to design multiple visualization types:
-
Data Integration & Automation
- Blended Excel-based data sources with Tableau for real-time updates.
- Designed and validated Tableau business scenarios to ensure accurate reporting.
- Published data
- extracts and dashboards to Power BI Online Services, enabling cloud access.
- Scheduled automated data refreshes on a daily, weekly, and monthly basis.
- MIS Reporting & Management Insights
- Developed interactive dashboards for procurement and client service metrics.
- Created clear and concise reporting formats for senior management reviews.
- Conducted weekly meetings to align data interpretation across departments.
Business Impact
Impact Area | Results Achieved |
Operational Efficiency | Reduced report preparation time by 60% through automation and pre-scheduled data extracts. |
Decision-Making | Delivered actionable insights with interactive dashboards, enabling faster procurement decisions. |
Data Accuracy | Improved consistency and trust in reporting with validated data and automated refreshes. |
Process Optimization | Visual procurement trend analysis led to process improvements and better vendor negotiations. |
Executive Visibility | Senior management gained real-time access to procurement performance metrics, enhancing strategic planning. |
Collaboration | Weekly data review meetings created a standardized approach to procurement analytics across teams. |
Technology Environment
- Visualization: Tableau
- Data Source: Excel
- Publishing & Scheduling: Power BI Online Services
- “SuperStore Dashboard” for Retail Analytics

Industry :
The Challenge
- Fragmented sales data: Sales, product, customer, and regional data were spread across several systems (POS, inventory, CRM), making integrated analysis difficult.
- Slow report turnaround: Business users had to wait for periodic static reports to understand performance; real-time or near-real-time insights were lacking.
- Lack of product & regional visibility: Hard to spot which products are under-performing, which regions or stores are lagging, or how sales are trending over time.
- Difficulty in monitoring profitability: Margins, discount impacts, cost of goods sold, and returns were not visible in the same view, making profitability analysis cumbersome.
- Limited interactivity: Reports were largely static; users could not drill down, filter dynamically, or compare scenarios effectively.
Scope of Project
- Bring together data from multiple sources (sales, inventory, customers, returns, channels) into one unified view.
- Provide real-time or near real-time insights into sales trends, product performance by category, regional/store comparisons, customer segments, and profit margins.
- Offer interactive features including filtering, drill downs (e.g., by product, region, time), top/bottom product lists, trend lines.
- Enable business users (store managers, merchandisers, senior management) to monitor KPIs such as sales growth, average order value, discount performance, returns rate, inventory turnover.
- Provide visual tools to analyze promotions, seasonal effects, product category performance, channel contributions etc.
Solution Provided
- Designed and built a Tableau Dashboard (“SuperStore Dashboard”) combining multiple views:
- Sales over Time: Trend lines and month-by-month comparisons.
- Region/Store Performance: Maps or bar charts comparing performance across geography.
- Product & Category Analysis: Top selling products, margin by category, discount impact.
- Customer Segmentation: Repeat vs new customers, average purchase size.
- Returns & Profitability: Return rates and margin erosion by discount or product type.
- Data integration setup:
- Combined data from POS, inventory, return systems, CRM.
- Data cleaning & transformation to standardize product/category naming, handle missing values etc.
- Dashboard interactivity:
- Filters (region, product category, time period).
- Drill down features (e.g. store → city → region).
- Parameter controls for user-selected scenarios (e.g. comparing periods, applying discount thresholds).
- Performance optimization:
- Some pre-aggregated tables / extracts for faster loading.
- Using incremental refreshes where possible.
- Deployment & sharing:
- Published dashboards to Tableau Server / Tableau Public for widest access.
- Role-based access: store managers vs regional managers vs senior executives.
Business Impect
| Area | Results / Improvements |
| Speed of Insights | Reports that used to take days to generate are now available in real time or near-real time, enabling faster decision-making. |
| Product & Regional Visibility | Under-performing products and regions are identified sooner; corrective actions (promotions, stock reallocation) implemented faster. |
| Profitability Awareness | Better visibility into discounts, returns, and cost structure improved margin management. |
| Enhanced Sales Performance | Increased sales growth through better alignment of inventory with demand, promotion effectiveness, and identifying high potential products. |
| Operational Efficiency | Reduced manual effort in reporting; fewer ad-hoc requests for data; dashboard reuse lowered load on data teams. |
| User Engagement & Decision Support | Business users (store/regional/senior management) adopted dashboard as a “single source of truth”; used daily to inform strategy. |
Tools & Technology Environment
- Visualization & BI Tool: Tableau Desktop, Tableau Server / Tableau Public
- Data Sources: POS (point of sale) systems, inventory management systems, CRM, returns data, product master data
- Data Preparation / ETL: Data cleaning, transformation (product names, categories, returns data), standardizing time periods etc. Possibly SQL / database extracts or data warehouses
- Performance Optimizations: Data extracts / aggregations, incremental refresh, optimized filters and parameter use
- User Access / Security: Role-based permissions, sharing via dashboards (server / public or private), filters at user level
- Retail Procurement Analytics Transformation
Industry :
The Challenge
- Providing senior management with monthly, quarterly, and half-yearly performance reports in a clear and consistent format.
- Ensuring data consistency across departments by sharing validated insights weekly.
- Extracting and preparing procurement data from ServiceNow web services, which required complex parsing and transformation before being usable.
- Managing data in formats unsuitable for direct visualization, requiring advanced data modeling and cleansing.
- Understanding domain-specific procurement metrics in order to create meaningful dashboards and KPIs.
- Consolidate and analyse data across locations and product lines.
- Implement secure, role-based access to sensitive data.
- Improve reporting performance and reduce manual effort.
Solution
A comprehensive data preparation and visualization framework was implemented, integrating Alteryx for data processing and Tableau/Power BI for reporting. The approach included:
- Data Extraction & Transformation
- Used Alteryx to connect with ServiceNow, parse unstructured data, and perform RegEx-based pattern matching.
- Modeled and transformed data into Tableau-compatible .TDE files for efficient use.
- Interactive Dashboards & Reports
- Designed dual-axis charts, combo charts, heat maps, geographic maps, small multiples, and drill-through reports to provide multi-dimensional insights.
- Developed calculated fields and parameters for custom KPIs aligned with procurement goals.
- Built interactive dashboards tailored to management requirements.
- Performance & MIS Reporting
- Automated generation of daily, weekly, and monthly procurement reports.
- Created MIS and performance dashboards for procurement and client service teams.
- Designed standardized reporting formats for consistent communication across departments.
- Publishing & Scheduling
- Published dashboards and data sources to Power BI Online Services.
- Scheduled refreshes (daily/weekly/monthly) to ensure real-time accuracy.
Business Impect
- Improved Procurement Efficiency: Senior management gained clear visibility into procurement KPIs, enabling faster and more accurate decision-making.
- Time Savings in Data Preparation: Automated data extraction and transformation with Alteryx reduced manual effort by over 40%.
- Faster Insights: Interactive dashboards allowed executives to drill down into procurement details instantly, cutting analysis turnaround times from weeks to hours.
- Consistency Across the Organization: Weekly reviews ensured that all departments had access to standardized, reliable data for planning and execution.
- Scalable Reporting Framework: The solution enabled easy addition of new data sources, KPIs, and visualization requirements without disrupting existing workflows.
Tools & Technology Environment
- Data Preparation: Alteryx (Parsing, RegEx, Data Extraction)
- Visualization: Tableau, Power BI
- Data Sources: Service Now Web Services
- Tableau Integration for a Leading Retail & Manufacturing Steel Supplier
Industry :
The Backgroud
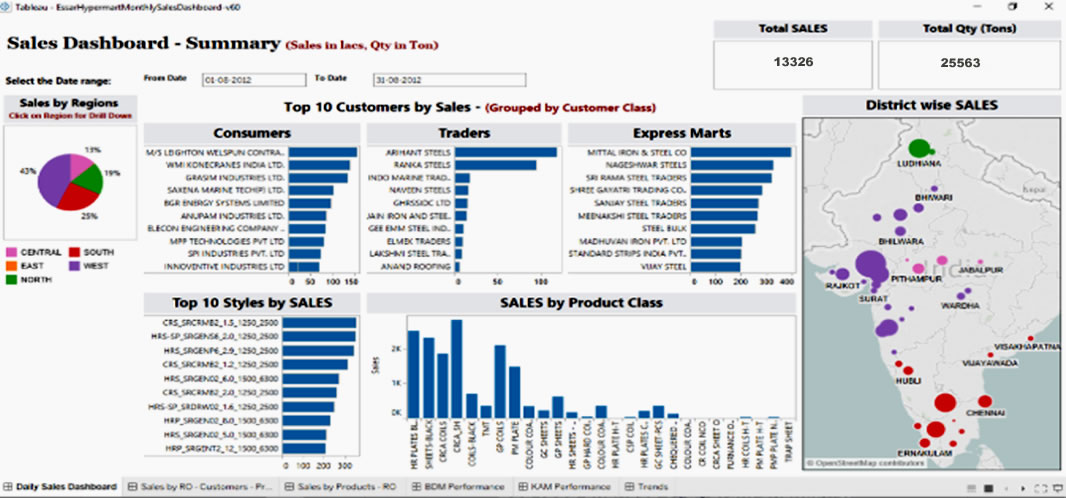
A leading retail and manufacturing steel supplier offers a wide range of steel products catering to multiple industry segments. With a robust distribution network and value-added services such as channel financing, doorstep delivery, and customised steel processing, the company serves both small and bulk buyers across Asia and North America.
The Challenge
The company generated large volumes of sales and operational data on a daily, weekly, and monthly basis, segmented by product type and location. The existing reporting process was fragmented, making it difficult for business teams to quickly analyse data, monitor performance, and make informed decisions. The company needed a powerful analytics platform integrated with its existing system to:
- Consolidate and analyse data across locations and product lines.
- Implement secure, role-based access to sensitive data.
- Improve reporting performance and reduce manual effort.
Scope of Project
- Tableau integration and configuration with the current platform.
- Development and testing of interactive dashboards.
- Matching Tableau Server authentication with the current platform.
- OLAP cube design, validation, and performance optimisation.
- Post-implementation support and maintenance.
Solution Delivered
The project involved the complete lifecycle implementation of Tableau analytics, ensuring seamless integration with the client’s existing systems. Key activities included:
- Custom Authentication & Security: Implemented Tableau Server authentication aligned with the current platform, along with cube-level and report-level security to safeguard sensitive information.
- Cube Design Validation: Verified all measures, dimensions, hierarchies, and calculated metrics for accuracy.
- Security Validation: Mapped cube roles to user groups and ensured correct access privileges.
- Performance Optimisation: Enhanced data processing speed and query performance for faster dashboard load times.
- Post-Implementation Support: Provided ongoing technical and user support for smooth adoption.
Business Impect
- 60% Reduction in Report Generation Time: Automated dashboards replaced manual reporting, enabling near real-time data access.
- Improved Decision-Making: Management could now access role-specific, accurate insights in minutes instead of hours.
- Enhanced Data Security: Role-based authentication ensured that sensitive sales and operational data was only visible to authorised users.
- Increased Operational Efficiency: Faster performance and automated analytics allowed business teams to focus more on strategy rather than data preparation.
- Scalability for Growth: The integrated Tableau platform could now easily handle growing data volumes and new reporting requirements.
Tools & Technology Environment
- Data Preparation: Alteryx (Parsing, RegEx, Data Extraction)
- Visualization: Tableau, Power BI
- Data Sources: Service Now Web Services
- Sales
The Challenge
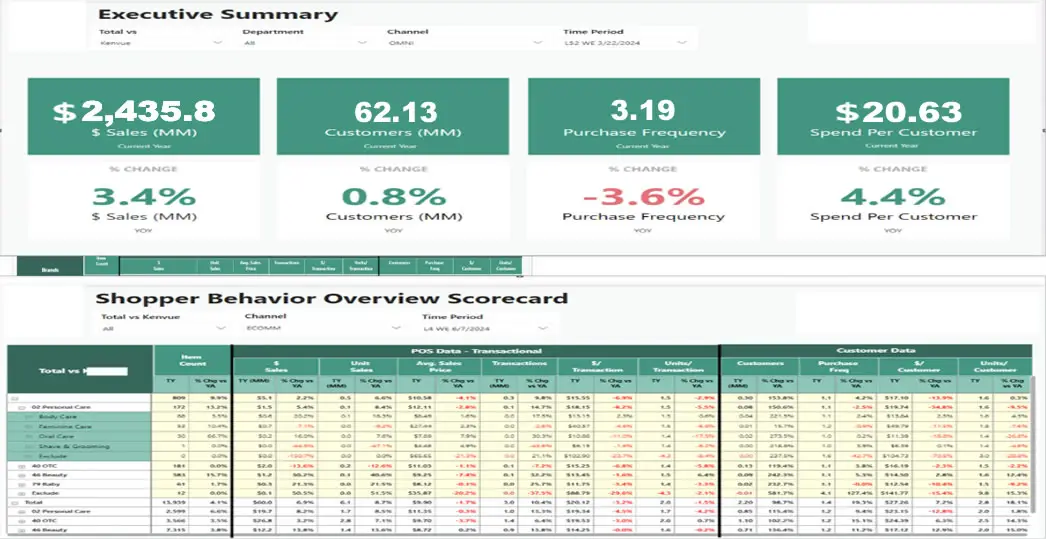
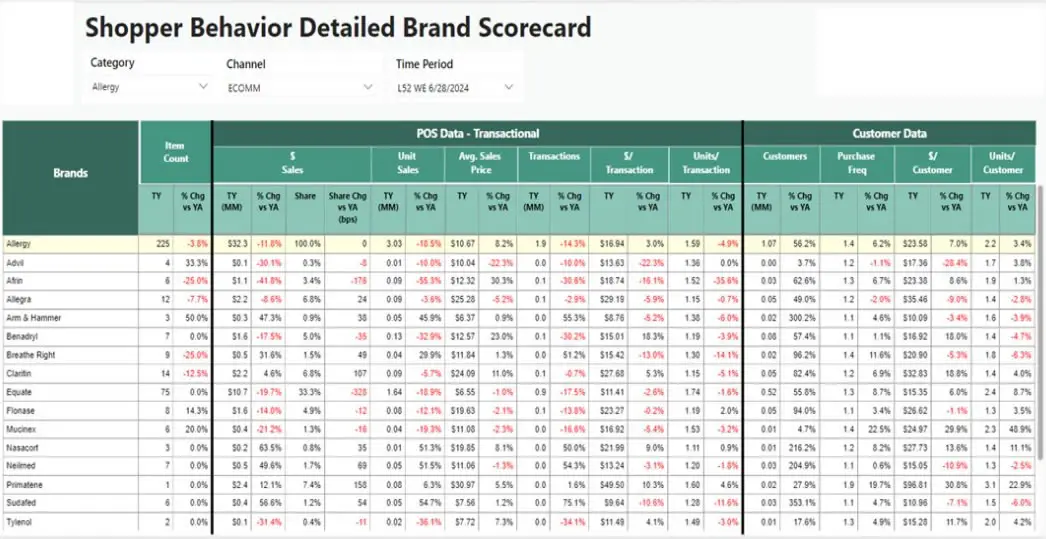
- Our Client Shopper Insights Project in which we built multiple Power BI Reports which provides in-depth transactional and customer data, offering insights into brand-level performance across multiple filters such as categories, channels, and time periods.
- Provides total market vs. brand performance at various levels, providing insights into transactional and customer purchase frequency.
- These reports comprise of aggregated metrics including sales, customer count, purchase frequency, and spend per customer, alongside their respective percentage changes.
- Using all the data which we downloaded from Luminate portal total 700 excels reports consists of multiple categorical data with different Segmentations and Time Periods to show the insights in the form of Power BI reports.
Scope of Project
- Automating & replicating manual approach of extracting Excel Reports, transforming them and refreshing Power BI Dashboards on a weekly cadence.
- A tool that leverages transactional and customer data to provide insights on the brand performance across channels and time periods.
Solution Delivered
- Built an automated streamlined process.
- Developed a data-optimized model to create a single source and increase performance.
- Built a Power BI dashboard based on provided UI design.
- Quality Process Optimization: Enhanced operational workflows and maintained consistent quality. ensured compliance with industry standards through rigorous quality control.
- Workload Reduction: Streamlined procedures and automated systems to reduce workload. achieved significant cost savings by minimizing rework and waste.
- Eliminated Human-Prone Errors: Implemented robust checks and automation to eliminate errors. increased accuracy and reliability, improving overall performance.
Business Impect
- Developed multiple Power BI reports to provide in-depth insights into transactional and customer data.
- Analyzed brand-level performance across categories, sales channels, and time periods.
- Reports offer comparative views of total market vs. brand performance, highlighting customer purchase behaviors.
- Key metrics include sales, customer count, purchase frequency, and spend per customer, with percentage changes.
- Sourced data from 700 Excel reports downloaded from the Luminate portal, containing segmented and time-based data.
- Enabled stakeholders to make data-driven decisions on brand strategies and market positioning.
- Provided clear, actionable insights into customer trends, helping to optimize resource allocation and enhance performance tracking.
Technology Stack
- Alteryx, Python, Selenium
- Healthcare Insurance Analytics
Industry
The Challenge
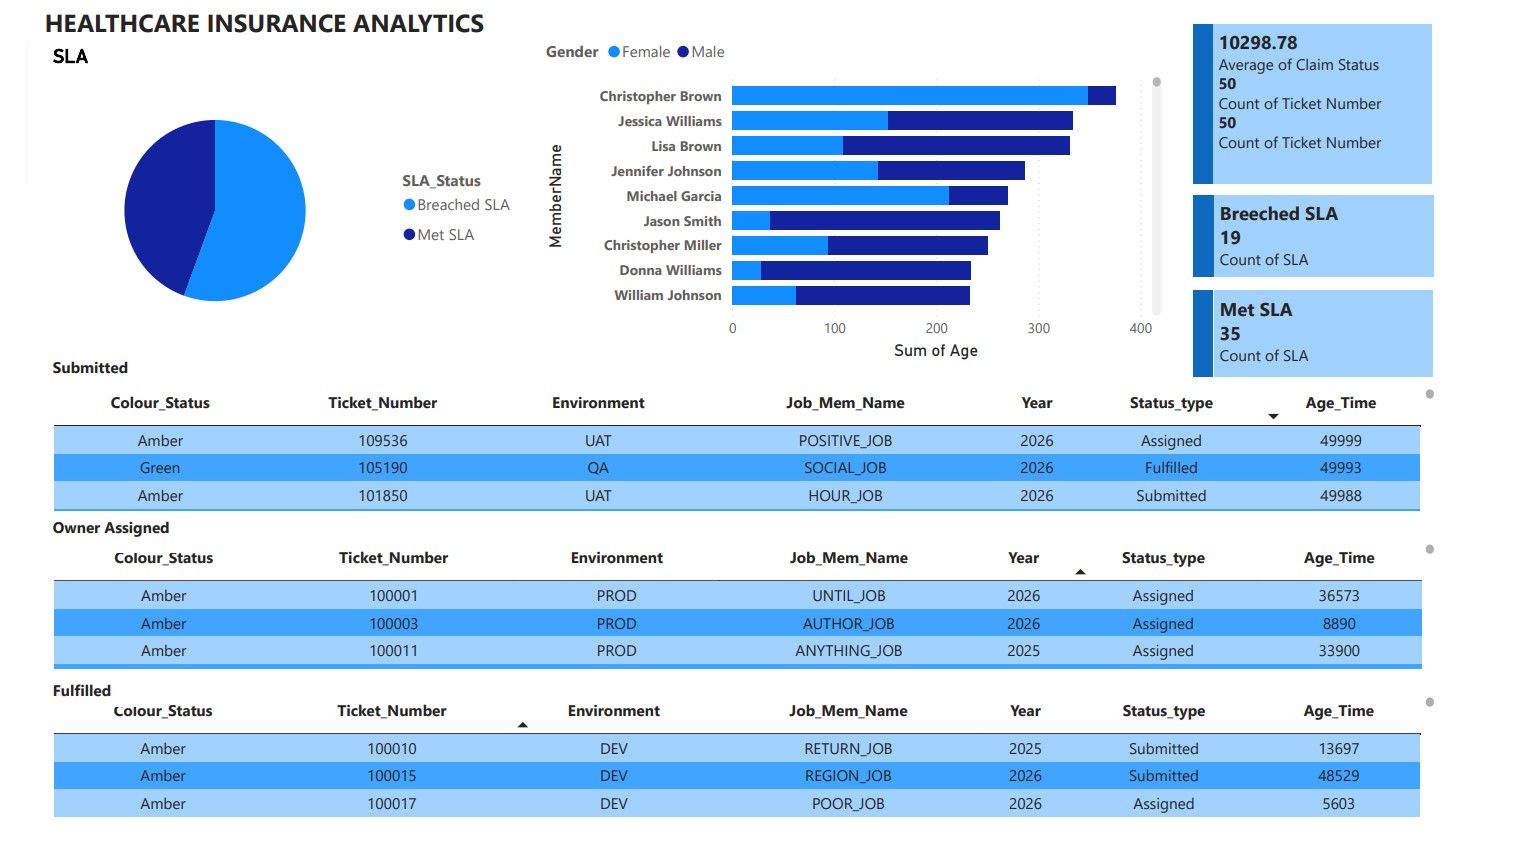
- Developing interactive dashboards in Power BI / Power View.
- Integrating dashboards into a SharePoint portal for centralized access.
- Enabling scheduled report refreshes at defined intervals.
- Providing business users with role-specific reporting and secure authentication.
- Tracking and analyzing ticket resolution times, success rates, and failure trends for service request management.
Solution
- Power BI Integration with SharePoint
- Architected and developed dashboards in Power BI / Power View, embedding them into SharePoint via web parts.
- Configured different authentication levels to ensure user-specific access.
- Operational & Service Request Analytics
- Designed dashboards to track ticket submissions, pending items, closed requests, and resolution timeframes.
- Implemented success vs. failure rate tracking for service tickets.
- Automated Refresh & Scheduling
- Enabled scheduled report refreshes to ensure up-to-date data availability.
-
Ad-Hoc & Role-Based Reporting
- Created business-user-specific dashboards tailored to operational needs.
- Provided ad-hoc reporting capabilities for deeper analysis.
Business Impact
- Improved Operational Efficiency: Real-time visibility into ticket resolution times helped reduce average closure time by 30%.
- Centralized Access to Insights: SharePoint integration provided a single, secure portal for all reporting needs, reducing time spent searching for information.
- Enhanced Decision-Making: Role-based dashboards empowered managers and operational teams to address service issues proactively.
- Increased Data Accuracy: Automated refresh schedules ensured that all dashboards were updated with the latest available data.
- Scalability for Future Growth: The solution allowed easy addition of new reports and dashboards without major redevelopment.
Technical Architecture
- BI & Visualization: Power BI, Power View
- Collaboration: SharePoint
- Database: SQL Server 2008
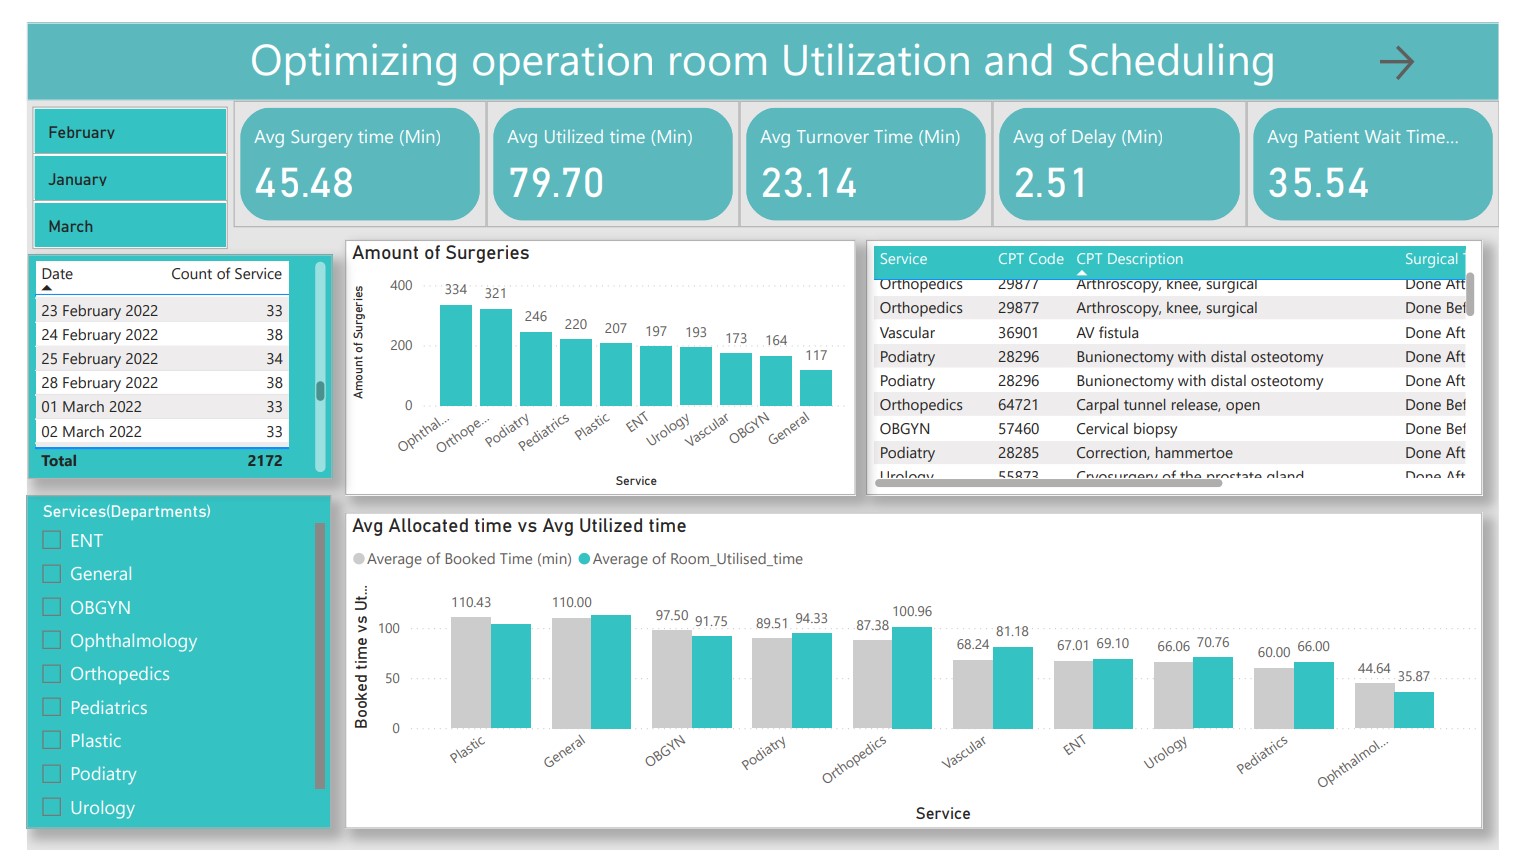
- HealthCare operating room (OR) utilization
Industry
Healthcare
The Challenge
- Underutilization of Operating Rooms (ORs): Idle time and inefficient use of available ORs.
- Scheduling Inefficiencies: Manual scheduling led to fragmented information across systems.
- Extended Turnover Times: Causing delays between surgeries.
- Patient Risks: Delays increased risks and patient dissatisfaction.
- Lack of Real-Time Visibility: Limited ability to track and monitor OR schedules dynamically.
Scope of Project
- Implement a data-driven solutionto optimize operating room utilization.
- Provide real-time visibility into OR scheduling, staff allocation, and delays.
- Enable management to identify peak usage, idle times, and resource constraints.
- Incorporate predictive analytics to forecast demand and improve planning.
Solution Provided
A comprehensive Power BI dashboard was developed to unify operating room utilization data, surgical schedules, and staff assignments into a single view. The project involved preparing and integrating data from multiple sources, ensuring consistency and accuracy before visualization.
The dashboard was designed to track key KPIs such as utilization rates, turnover times, and schedule adherence, while offering real-time monitoring that enabled hospital administrators to quickly adjust resources and reduce delays.
To support long-term planning, predictive analytics were incorporated, leveraging historical patterns to forecast OR demand and identify recurring bottlenecks. The dashboards were also built with interactive features, allowing users to drill down by department, surgeon, or time period, transforming reporting into a powerful decision-support tool.
- Developed a Power BI dashboard integrating OR utilization data, surgical schedules, and staff assignments.
- Data Preparation: Collected, cleaned, and transformed data from multiple sources using Excel and integrated into Power BI.
- KPI Tracking: Monitored utilization rates, turnover times, and adherence to planned schedules. Real-Time Monitoring: Enabled quick adjustments to scheduling and resource allocation.
- Predictive Analytics: Forecasted OR demand based on historical usage patterns.
- Interactive Dashboards: Allowed hospital management to analyze data, reduce delays, and make informed decisions.
Business Impact
- Increased OR Utilization: Reduced idle time and improved resource usage.
- Improved Revenue & Efficiency: Optimized scheduling increased throughput, resulting in higher operational efficiency.
- Reduced Patient Wait Times: Faster scheduling and reduced delays improved patient satisfaction.
- Enhanced Decision-Making: Real-time dashboards empowered leadership with actionable insights.
- Future-Readiness: Predictive analytics provided a foundation for continuous process improvements.
Technical Architecture
- Visualization Tool: Power BI (with DAX functions, calculated columns, interactive dashboards).
- Data Source: Excel, hospital scheduling systems.
- Data Processing: Data cleaning, transformation, and integration workflows.
- Analytics: Real-time dashboards, KPI visualization, predictive analytics models.
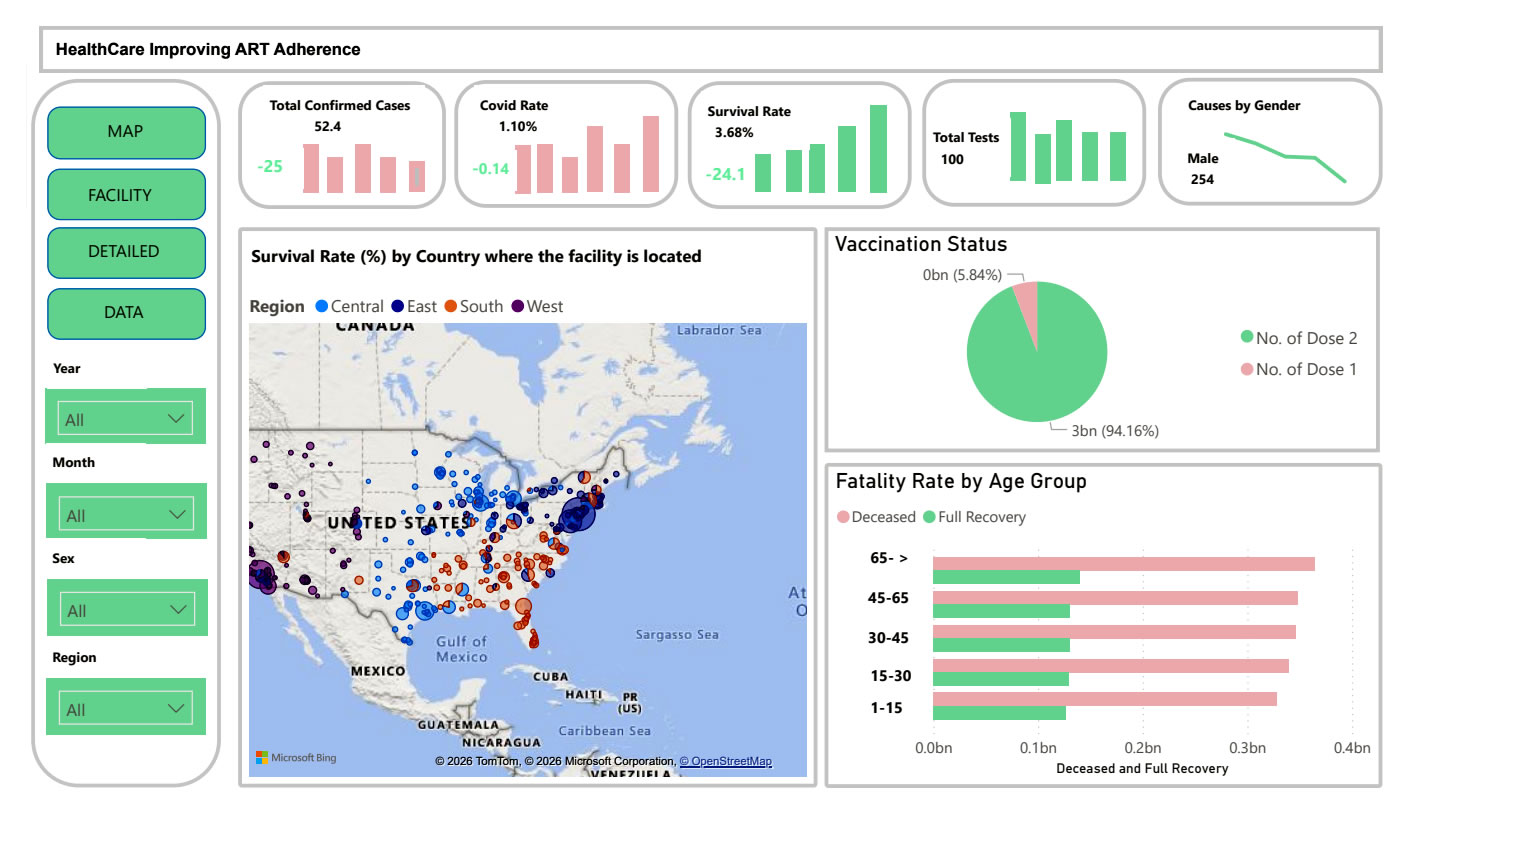
- HealthCare Improving ART Adherence
Challanges
Scope of Project
The project aimed to develop a real-time analytics solution that would enable healthcare providers to track ART adherence, monitor patient well-being, and manage the impact of external disruptions such as pandemics on treatment continuity. The focus was on creating a standardized, data-driven approach to improve patient support, optimize resource allocation, and ensure consistent healthcare delivery across all treatment centers.
Solution Provided
- A centralized Power BI dashboard was designed to bring together ART adherence data, patient well-being indicators, vaccination records, and regional performance metrics. This dashboard provided a unified view of treatment outcomes in near real time.
- Data preparation and integration involved consolidating information from multiple sources such as patient records, appointment logs, and survey data. This ensured that all metrics were accurate, up-to-date, and consistent.
- KPI monitoring allowed providers to track adherence levels, vaccination coverage, and treatment continuity, while automated alerts flagged at-risk patients requiring immediate follow-up.
- Power Apps forms were deployed to simplify data entry for healthcare staff, enabling quick updates on patient interactions, adherence checks, and follow-up visits.
- Interactive features allowed healthcare managers to drill down into specific clinics, demographic groups, or treatment outcomes, enabling precise interventions.
- Predictive analytics were applied to identify patients most likely to default on treatment, helping providers take preventive action.
Business Impact
- Improved adherence rates, reducing the risk of treatment failure and improving long-term health outcomes.
- Enhanced patient support, with early identification of mental health challenges such as anxiety and depression.
- Stronger continuity of care, with vaccination tracking and treatment monitoring reducing the risk of disruption.
- Efficient resource allocation, ensuring services were directed to the areas and patients that needed them most.
- Proactive decision-making, shifting the model from reactive crisis management to proactive healthcare delivery.
Technical Architecture
- Visualization & Analytics: Power BI (real-time dashboards, KPI monitoring)
- Data Collection & Entry: Microsoft Power Apps (for staff data input and patient updates)
- Data Storage & Collaboration: SharePoint (central repository and data sharing)
- Data Processing & Integration: Excel and survey datasets integrated into the BI platform
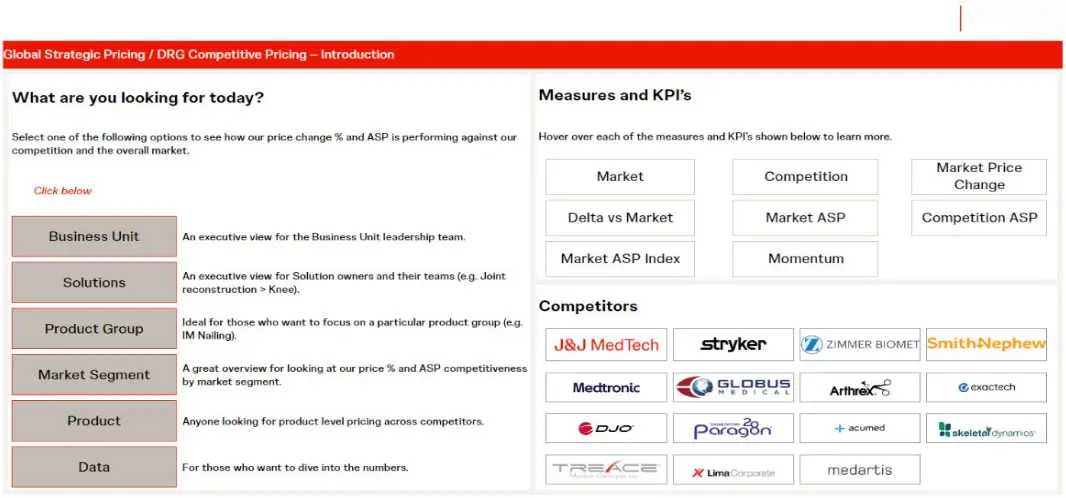
- Competitive Pricing Analytics
Challanges
The MedTech business faced significant hurdles in monitoring and comparing its pricing performance with competitors. There was limited visibility into Average Selling Price (ASP) and market pricing trends across platforms and regions. Competitor data was fragmented and difficult to access, making it challenging for business stakeholders to align their pricing strategies with market realities.
Without an integrated system, teams were spending significant time gathering data manually from disparate vendors and validating it, which delayed decision-making. The lack of real-time, reliable insights also reduced the ability to react quickly to market changes or competitive moves.
Scope of Project
- Deliver competitive ASP and market pricing comparisons at both the platform and overall business level.
- Enable leadership and sales teams to analyze performance against competitors on a yearly basis.
- Provide intuitive and interactive visualizations to support faster, data-driven decision-making.
- Establish a scalable and reliable architecture for continuous market insights.
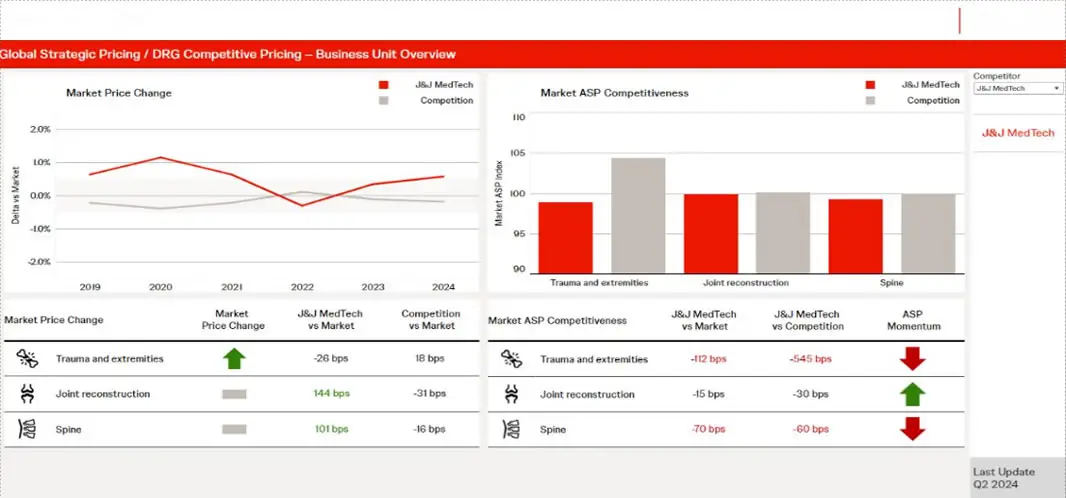
Solution Provided
- Data Integration and Preparation
- Collected and consolidated pricing and market data from multiple external vendors such as DRG and ECRI.
- Data was ingested into Amazon Redshift where it was standardized, cleaned, and validated.
- Additional validation and cross-checks were performed using SQL queries and Excel-based rules to ensure accuracy.
- Visualization and Analytics
-
A Tableau dashboard was designed to display key pricing metrics including:
- Market Price (sales/volume by country, product hierarchy, and year).
- Construct ASP and ASP momentum.
- Competitive comparisons for ASP vs competition, both current and year-over-year.
- Dashboards were made interactive, allowing users to filter by country, region, platform, and competitor to quickly analyze specific market segments.
-
A Tableau dashboard was designed to display key pricing metrics including:
- Business Usability and Insights
- Provided a customer-centric market view, allowing pricing and sales teams to align strategies with competitive benchmarks.
- Incorporated ASP momentum tracking to evaluate changes against prior years and adjust pricing tactics.
- Enabled stakeholders to access dashboards through Tableau Server, ensuring real-time accessibility and collaboration across global teams.
- Scalability and Future Readiness
- The architecture was designed for easy expansion to include new vendors, additional geographies, and updated KPIs.
- Automated refreshes ensured that the dashboards always reflected the most current market data.
Business Impact
- Faster and Better Pricing Decisions: Decision-makers gained the ability to compare ASPs across competitors instantly, rather than relying on delayed manual reports.
- Improved Market Responsiveness:Real-time dashboards allowed pricing teams to react quickly to competitor moves and adjust strategies to maintain market competitiveness.
- Operational Efficiency: Reduced manual data collection and validation efforts, freeing up resources for deeper strategic analysis.
- Customer-Centric Insights: Sales and franchise teams could now align more closely with customer expectations and market dynamics, strengthening competitive positioning.
- Strategic Alignment: Leadership gained a consolidated view of global pricing performance, improving planning and forecasting accuracy.
Technical Architecture
- Data Storage & Processing: Amazon Redshift
- Data Validation: SQL, Excel
- Visualization & Reporting: Tableau (Scorecard dashboards, competitor ASP analysis, momentum tracking)
- Data Sources: Vendor-provided datasets (DRG, ECRI, and other MedTech market data)
- Deployment: Tableau Server for global accessibility and collaboration
- Enhancing Oil & Gas Field Intelligence through Real-Time Analytics and Dashboard Integration

The Challenge
Industry : Oil & Gas
- Aggregated reporting from diverse field devices.
- Integration of streaming video and SCADA data.
- Performance optimization of large-scale data reports.
- SharePoint portal integration for field users.
- Real-time analytics across multiple devices and systems.
Scope of Project
- Tableau Integration with SharePoint portal
- Tableau Server Authentication via Active Directory
- Big Data Hadoop connectivity for historical and streaming data
- Dashboard development for production analysis, loss code, and gas metrics
- Post-implementation support and training for internal teams
Solution
Key Deliverables:
- Developed Tableau dashboards for:
- Oilfield production by location
- Gas production metrics
- Loss code and event analysis
- Integrated Hadoop/HBase as a data source to manage large-scale field data.
- Designed efficient data schemas to enable scalable and performant queries.
- Created calculated fields, sets, parameters, and filters for deep-dive analytics.
- Embedded dashboards into the SharePoint portal for centralized access.
- Configured Tableau Server with user management, scheduling, and security.
- Enabled drill-down capabilities for teams to investigate root causes of incidents or downtime.
Business Impact
- Enhanced Operational Visibility: Real-time dashboards provided on-demand insight into oilfield performance and incident trends.
- Improved Decision-Making: Event management and emergency response teams could make faster, data-backed decisions.
- Scalable Reporting Infrastructure: Big Data integration ensured that massive datasets could be analyzed without latency.
- Streamlined Access: SharePoint integration allowed easy access for distributed teams.
- Reduced Downtime: Early detection of production issues helped minimize revenue losses.
Technology Environment
- Visualization & BI : Tableau Desktop, Tableau Server
- Data Infrastructure : Big Data Hadoop, HBase
- Portal & Collaboration : Microsoft SharePoint
- Authentication : Active Directory
- HR Dashboard Analytics Implementation
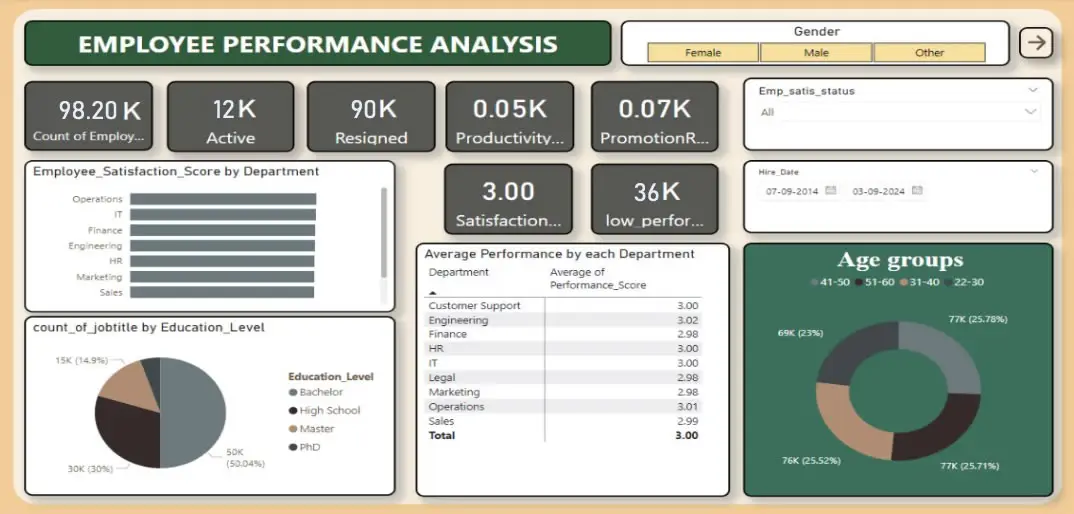
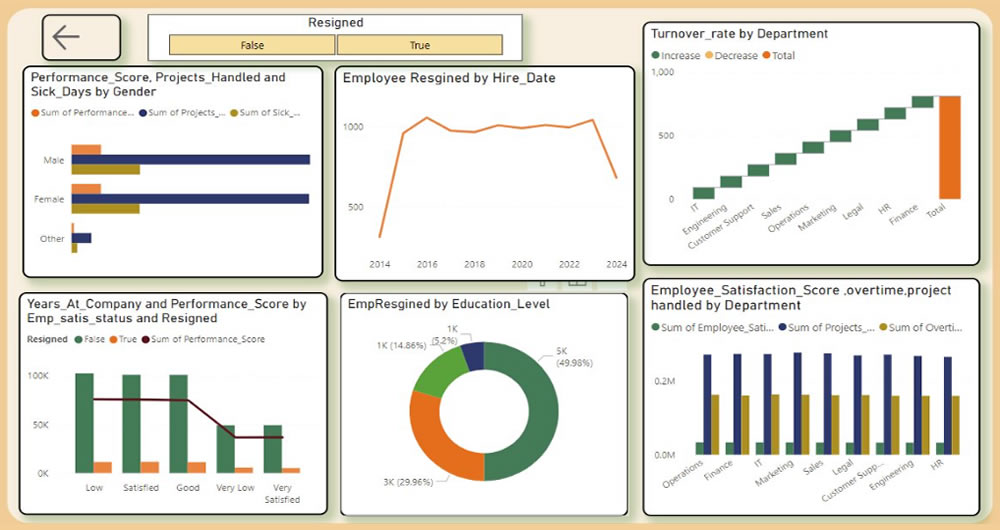
The Challenge
The organization was experiencing high employee attrition, with nearly 90% of employees leaving. Despite a moderate productivity score, low employee satisfaction was evident, particularly in certain departments. Promotion and training opportunities were inconsistent, leading to dissatisfaction, low motivation, and uneven performance. The absence of data-driven decision-making made it difficult to identify the root causes of these issues, such as burnout, dissatisfaction, or workload imbalance.
Scope of the Project
- Reduce attrition and improve retention.
- Identify low-performing areas and underlying causes of dissatisfaction.
- Balance workloads and improve productivity.
- Create fairer promotion and recognition systems.
- Provide actionable insights to management for data-driven HR strategies.
The Solution
- Data Integration & Preparation: Employee data from multiple sources (Excel and internal HR systems) was collected, cleaned, and transformed. DAX functions were applied to calculate KPIs such as satisfaction scores, attrition rates, overtime hours, and promotion frequency.
- Workforce Insights: The dashboard provided department-level analysis of satisfaction scores, identifying areas with high dissatisfaction and turnover. These insights guided targeted retention programs, such as recognition initiatives and competitive promotions.
- Training & Development Monitoring: Gaps in training were identified, and standardized programs were recommended across departments to boost performance.
- Workload Balancing: Analysis of overtime and total work hours highlighted departments at risk of burnout. Workload was redistributed or additional hiring was suggested to balance productivity with well-being.
- Promotion & Recognition Fairness: Data revealed uneven promotion trends. Recommendations included implementing performance-based promotion policies to motivate employees and reduce dissatisfaction.
- Satisfaction Monitoring: Work-life balance and recognition initiatives were tracked, enabling HR teams to act quickly when scores declined.
business Impact
- Reduced Attrition: Identification of key attrition drivers allowed the organization to design targeted interventions, improving employee retention.
- Improved Productivity: Balanced workloads and expanded training initiatives enhanced overall workforce efficiency.
- Higher Employee Satisfaction: Recognition programs, fair promotions, and proactive monitoring raised satisfaction scores.
- Cost Savings: Lower recruitment and training costs due to reduced turnover.
- Data-Driven HR: Management gained real-time visibility into employee metrics, enabling smarter decisions.
Technology Used
- Data Source: Excel and internal HR systems
- Data Preparation & Transformation: Power BI (DAX functions, data modeling)
- Visualization: Power BI dashboards for HR, leadership, and department managers
- Analytics: Attrition analysis, satisfaction trends, workload distribution, promotion monitoring
- Human Resources

The Challenge
- Lack of centralized visibility into HR metrics (e.g. employee turnover, hiring pipeline, absenteeism, performance) across departments.
- Delayed or static reporting—HR reports were periodically generated (monthly or quarterly), limiting ability to respond quickly to emerging issues.
- Data silos—information about employee demographics, performance reviews, training, and attrition were stored in different systems, making it hard to correlate metrics.
- Difficulty identifying patterns or anomalies—for example sudden spikes in turnover, low training completion in particular teams, or high absenteeism—due to limited drill-down capability.
- Manual data processing burden—HR staff spent significant time aggregating and cleansing data to prepare reports.
Scope of the Project
- Build an interactive HR Dashboard to enable leadership and HR teams to monitor critical personnel metrics in near real time.
- Consolidate HR data from various sources (HRIS, performance management, recruiting, training, attendance systems).
- Provide visualizations for key metrics like headcount, attrition, hiring status, training compliance, employee performance, absenteeism.
- Enable filters and drill-down by department, location, role, time period to allow team-specific insights.
- Automate reporting and dashboards to reduce latency and manual work.
The Solution
- Designed and developed a Tableau-based HR Dashboard showing key HR metrics in an at-a-glance format:
- Employee headcount trends over time
- Turnover rates by department/location
- Hiring pipeline (open roles, candidates, time to hire)
- Training compliance and completion rates
- Absenteeism and leave trends
- Performance rating distributions and evaluation status
- Data integration: pulled together data from HRIS, recruiting systems, attendance / time tracking tools, learning management systems, performance review platforms.
- Data transformation and preparation: standardizing employee role titles, handling missing data, ensuring consistency in categorization (locations, departments).
- Dashboard interactivity: filters by department, location, role, time period; ability to drill down into specific groups; comparisons over time (month-over-month, year-over-year).
- Automated refresh: schedule data extracts and refreshes to keep dashboards up to date.
- Visualization design: user-friendly layout, clear KPIs, color-coded alerts or signals for metrics outside of thresholds.
Business Impact
Impact Area | Results / Benefits |
Improved Decision-Making | HR leadership can now identify rising turnover in specific departments early, enabling targeted interventions before loss becomes critical. |
Efficiency Gains | Reduced time for HR reporting by ~50–70%, freeing HR team to focus on strategic initiatives rather than manual data compilation. |
Better Visibility | Continuous visibility into hiring pipelines helps avoid staffing shortages and react faster when hiring lags. |
Training Compliance | With dashboard tracking, increased training completion rates and better compliance with required learning modules. |
Reduced Absenteeism Impact | Monitoring absenteeism patterns allowed HR to spot problematic trends (departments with high unscheduled leave) and address underlying causes. |
Employee Engagement & Retention | Transparent performance review metrics and faster resolution of HR issues improve employee satisfaction and retention. |
Technology Used
- Visualization / BI Tool: Tableau Desktop / Tableau Server (or Tableau Online)
- Data Sources: HR Information System (HRIS), Recruiting / ATS system, Learning Management System (LMS), Attendance / Time Tracking, Performance Review Tools
- Data Storage / ETL: SQL Database / Data Warehouse for staging and integrating HR data; data cleaning and transformation pipelines
- Automation / Scheduling: Automated extracts / refresh schedules for dashboard data to remain current
- User Access & Security: Role-based dashboard access, filters to control visibility (e.g., managers see only their own team data)
- Automobile Industry BI Integration
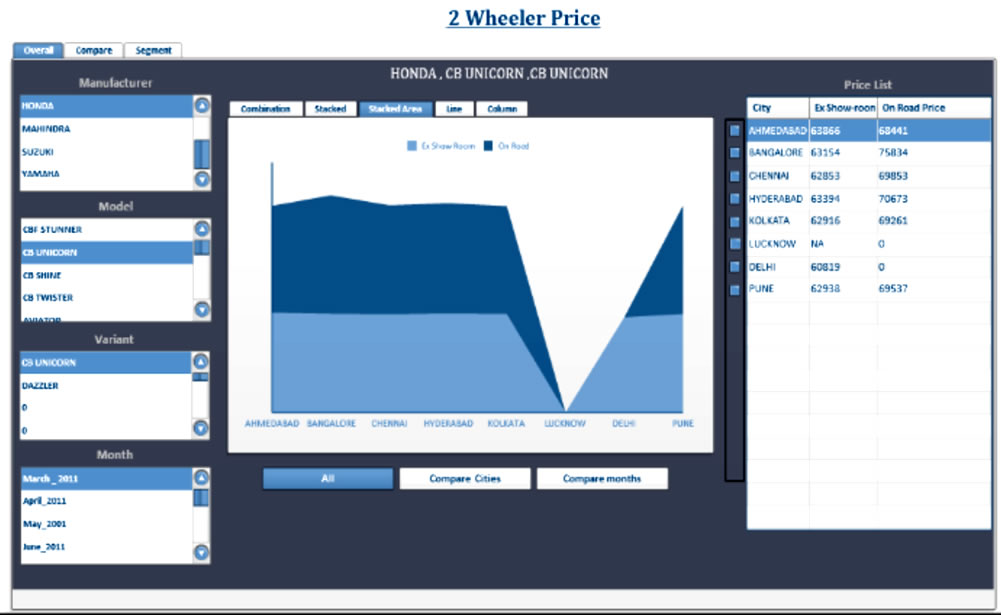
The Challenge
- Enabling comparisons of pricing trends across competitors and different months.
- Ensuring seamless integration of BusinessObjects (BO) with the existing platform.
- Implementing custom authentication and security controls to align with the company’s policies.
- Validating cube designs, hierarchies, and calculated measures to ensure reporting accuracy.
- Improving processing and query performance for end users.
Solution
The project involved a complete lifecycle implementation of BO integration with the client’s existing platform. Key activities included:
- BO Integration & Authentication
- Configured and integrated BusinessObjects with the existing platform.
- Implemented custom authentication mechanisms on BO Server to align with enterprise security policies.
- Data Security & Access Control
- Designed and validated cube roles and user group matrices.
- Ensured cube-level and report-level security to protect sensitive pricing data.
- Cube Design Validation
- Validated measures, dimensions, hierarchies, and calculated fields within the OLAP cubes.
- Ensured accuracy of pricing and comparison analytics.
- Performance Optimization
- Tuned cube processing and query performance, reducing report response times.
- Post-Implementation Support
- Provided ongoing support for BO integration, troubleshooting, and enhancements.
Business Impact
- Business Impact Enhanced Pricing Transparency: Enabled management to compare on-road and ex-showroom prices across competitors and timeframes, leading to more informed pricing strategies.
- Stronger Data Security: Custom authentication and role-based security ensured sensitive pricing information was only accessible to authorized users.
- Improved Performance: Optimized cube and query processing reduced reporting time by over 45%, ensuring faster decision-making.
- Seamless Integration: Successful BO integration with the existing platform ensured smooth user adoption without disrupting business operations.
- Scalable Analytics Framework: The solution provided a foundation for expanding analytics into other business areas beyond pricing.
Technology Environment
- Business Intelligence Tools: BusinessObjects, Xcelsius 2008
- Integration: OLAP Analysis, Custom BO Server Authentication .
- Insurance Sector Data Analytics Enhancement
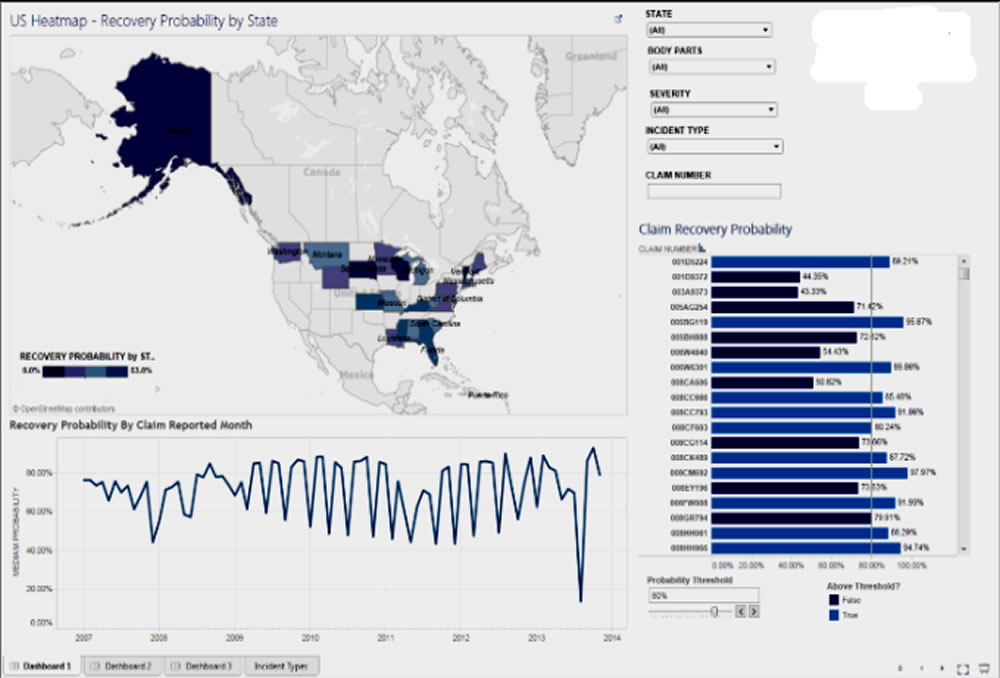
Industry :
Insurance & Financial Services
The Challenge
The client’s secure, integrated application supported core business functions such as claims management, recovery tracking, severity analysis, and branch-level operations. However, they faced:
- Performance issues in Tableau dashboards, causing delays in accessing critical insights.
- The need to develop multiple reports and dashboards to analyze claims, severity, and probability thresholds across various locations.
- Limited ability to dynamically adjust and analyze recovery metrics based on different operational parameters.
The Solution
- Data Aggregation & Visualization
- Designed and implemented optimized data aggregations for Tableau Dashboard and Tableau Server to handle large datasets efficiently.
- Created interactive reports for claims, severity, and recovery probability analysis.
- Predictive Recovery Model
- Built a model to predict claim recovery probability, categorizing claims into recovery probability buckets for proactive follow-up.
- Dynamic Analysis Parameters
- Introduced parameters for Loss Amount, Recovered Amount, Recovery Probability, and Probability Threshold to allow flexible, scenario-based analysis.
- Quality & Performance Improvements
- Developed quality-check reports to validate aggregated data accuracy.
- Resolved a large backlog of critical reporting issues.
- Performance-tuned slow-running dashboards and recommended database design changes to improve query speed.
- Stakeholder Collaboration
- Worked closely with business teams to gather evolving requirements and implement enhancements iteratively.
Business Impact
- Improved Decision-Making : The predictive recovery model enabled data-driven prioritization of recovery efforts, leading to faster claim resolution.
- Increased Reporting Efficiency : Dashboard load times were reduced by over 60%, enabling real-time access to operational insights.
- Operational Flexibility : Dynamic parameters empowered analysts to explore multiple recovery and loss scenarios without additional development effort.
- Enhanced Data Reliability : Quality validation processes ensured higher accuracy in financial and operational reporting.
- Scalable Architecture : The optimized design allowed easy addition of new reporting dimensions and metrics in the future.
Technology Environment
- BI & Visualization: Tableau Desktop, Tableau Server
- Database: SQL Server 2008
- Telecommunication
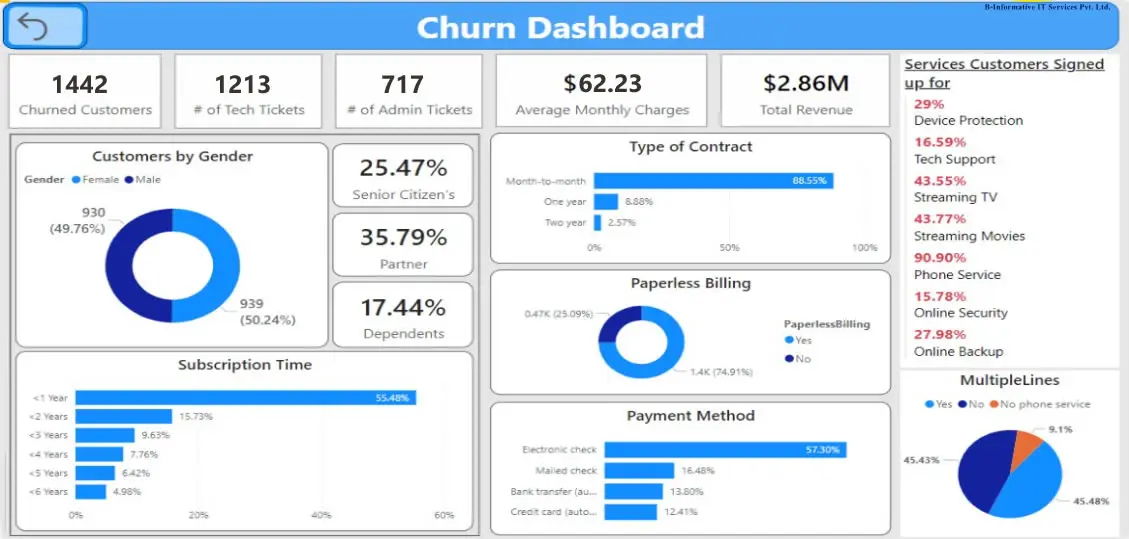
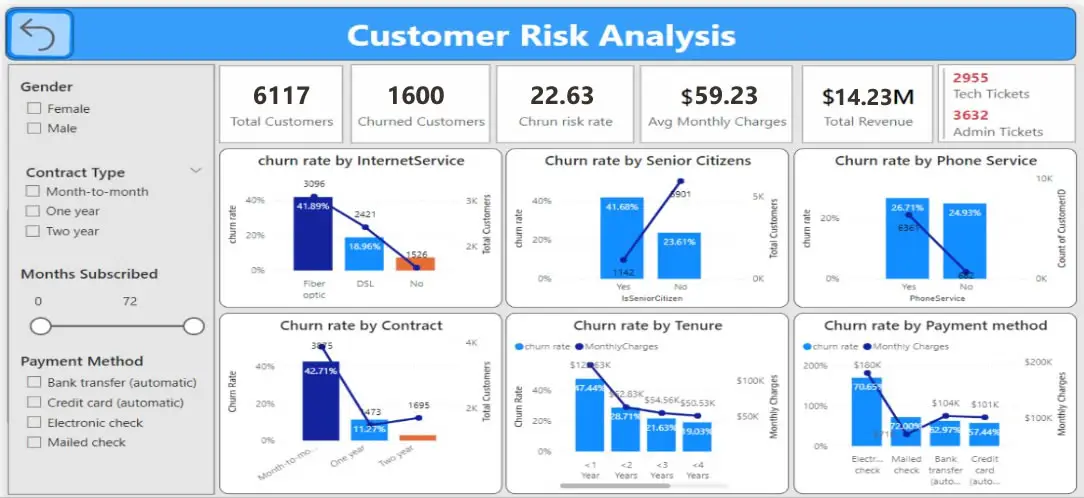
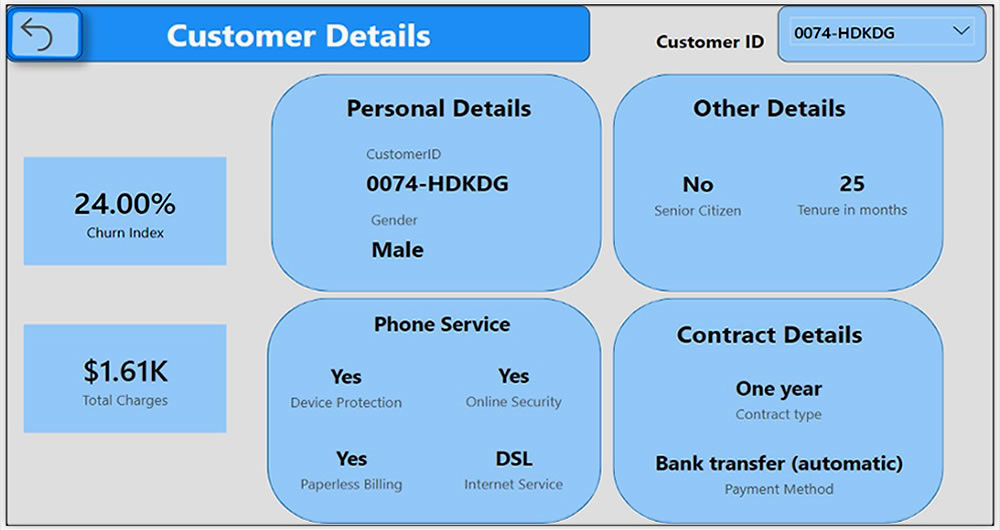
The Challenge
The telecom company is struggling with high customer churn rates, where customers frequently switch to competitors by porting their SIM cards, leading to significant revenue loss and profitability challenges.
- Fragmented Data Sources
- Lack of Predictive Insights
- Ineffective Retention Campaigns
- Delayed Decision-Making
- High Customer Acquisition Costs
- Customer Dissatisfaction
Scope Of Project
- Identify high-risk customers through Data analytics.
- Centralized Data Integration.
- Customer Segmentation for Personalized Campaigns.
- Monitor churn trends in real-time dashboards.
- Proactive Alerts and Automation
Business Problem
The telecom company faced high customer churn rates, leading to revenue loss and increased operational costs
The Solution
Implementing a churn analytics solution using Power BI to address the challenges.
- Predictive Analytics for Churn Prediction:
- Forecast models were developed to identify high-risk customers based on usage patterns, complaints, and payment behavior.
- Customer Segmentation:
- Customers were grouped by demographics, service usage, and preferences, enabling targeted retention efforts.
- Personalized Retention Campaigns:
- Tailored offers, service upgrades, and promotions were deployed to at-risk customers, enhancing engagement and reducing churn.
- Proactive Decision-Making:
- Automated alerts were set up for key stakeholders, ensuring timely actions to retain customers before they churn.
Implementation
- Began by analyzing Telecom customer dataset that included key features like customer demographics, tenure, services signed up for, and churn status.
- Using Power BI, I cleaned the data and created relevant calculated columns and measures to capture customer behaviors such as service utilization, and tenure metrics.
- Key performance indicators like average tenure, churn risk percentage, customer retention rates, and service usage were
presented in Power BI dashboards.
Business Impact
- The solution provided a clear understanding of individual customer churn risks based on historical data, service usage,
and demographics. - The interactive Power BI dashboard allowed stakeholders to drill down into specific customer segments and evaluate the
effectiveness of different services and contracts. - The integration of metrics like churn risk and tenure allowed for the automation of identifying at-risk customers, enabling
proactive outreach and support. - This helped improve resource allocation and customer engagement strategies, resulting in reduced churn and higher
retention rates.
Technology USED
- Power query, Power Bi , SQL Server
- Energy Sector Digital Transformation
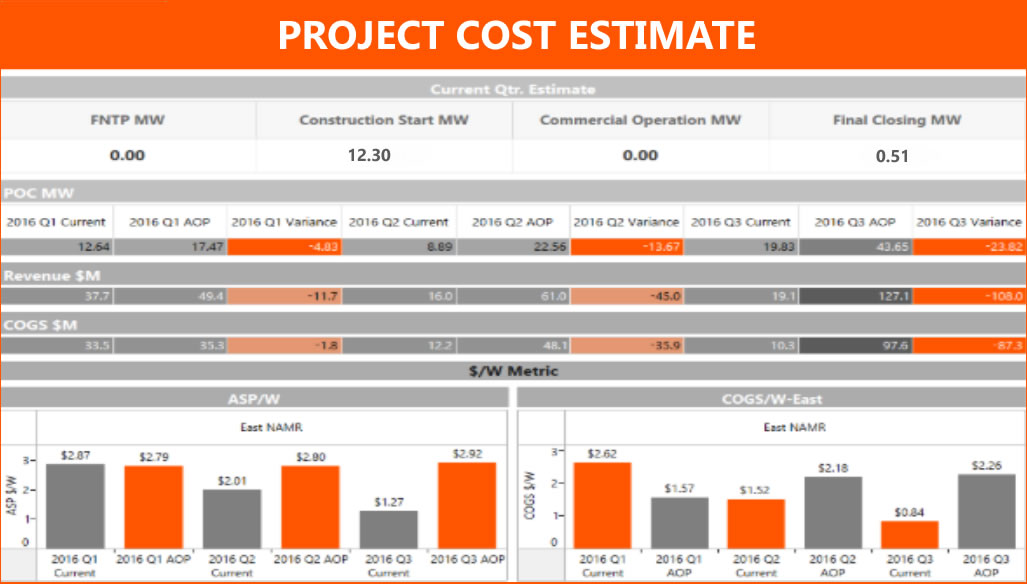
Industry
- Energy & Renewable Solutions
The Challenge
The client needed a centralized platform to efficiently create, manage, and monitor solar energy projects. Key requirements included:
- Project creation and management within a custom application.
- Detailed costing breakdown for each project segment.
- Dynamic project creation forms that adapt based on project type (e.g., Ground Mount, Rooftop, Canopy).
- Ability to assign projects to specific users depending on their roles.
The existing process lacked automation, dynamic data handling, and performance-optimized reporting, making it difficult to track progress, costs, and recovery rates effectively.
The Solution
The engagement involved architecting, designing, and implementing robust data aggregation and visualization capabilities, alongside predictive analytics. The key steps included:
- Tableau Dashboard & Server Implementation
- Designed and deployed interactive dashboards for project tracking, cost analysis, and recovery forecasting.
- Predictive Recovery Model
- Built a model to predict the probability of recovering claims, allowing classification into recovery probability buckets and enabling proactive decision-making.
- Quality & Performance Optimization
- Developed quality check reports to ensure accuracy of aggregated data.
- Performance-tuned slow-running reports, improving data retrieval times significantly.
- Recommended and implemented critical database design changes for efficiency.
- Requirement Analysis & Iterative Enhancements
- Collaborated with business stakeholders to capture evolving requirements.
- Analysed, designed, and implemented feature enhancements based on operational needs.
Business Impact
- Enhanced Decision-Making : The predictive model provided actionable insights into claim recovery likelihood, helping prioritize recovery efforts and reduce losses.
- Operational Efficiency : Dynamic forms and role-based project assignment streamlined project creation and tracking, cutting down administrative time.
- Faster Reporting : Optimized dashboards and database design reduced report load times by over 50%, ensuring timely access to critical project data.
- Improved Data Accuracy : Quality-check mechanisms minimized reporting errors, boosting trust in analytics outputs.
- Scalability : The architecture allowed for easy integration of new project types and reporting requirements, future-proofing the system.
Technology Environment
- BI & Visualization: Tableau Desktop, Tableau Server
- Database: SQL Server 2008
- Real Estate Digital Property Platform Analytics
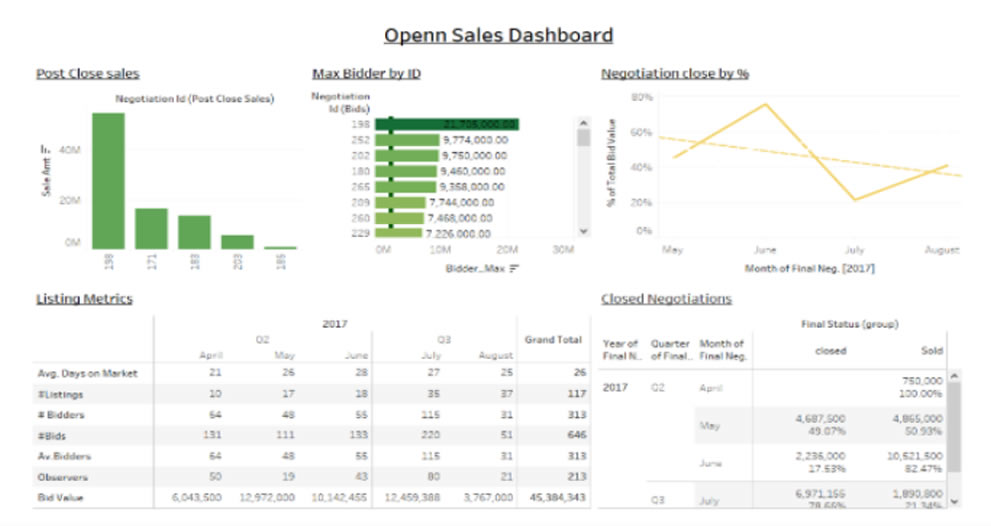
The Challenge
The client was developing an online property purchasing platform aimed at creating a transparent and fair marketplace for buyers and sellers. Managed by real estate professionals, the platform allowed qualified buyers to openly negotiate prices while seeing the number of competing buyers in real time.
The challenges included:- Designing and implementing Tableau dashboards to provide real-time insights.
- Managing Tableau Server operations, including user creation, authentication, project setup, and backup.
- Ensuring accurate data aggregation and reporting.
- Understanding and adapting to the complex architectural requirements for Tableau dashboard and server integration.
Solution
A complete BI solution was delivered using Tableau for visualization and SQL Server for data management. Key actions included:
- Dashboard Development
- Designed interactive Tableau dashboards providing property negotiation insights, buyer competition trends, and pricing analytics.
- Server & User Management
- Managed Tableau Server, handling user and project creation, authentication setup, and system backup for business continuity.
- Data Aggregation & Quality
- Implemented and documented robust aggregation processes for data accuracy.
- Developed quality-check reports to validate aggregated datasets.
- Business Requirement Alignment
- Collaborated with business stakeholders to gather evolving requirements.
- Designed and implemented enhancements to support new use cases and reporting needs.
Business Impact
- Transparency & Trust: The dashboards enhanced platform credibility by allowing buyers and sellers to see real-time insights on competition and pricing.
- Improved Decision-Making: Accurate, quality-checked reports empowered real estate agents and buyers with reliable data for negotiations.
- Operational Efficiency: Centralized Tableau Server management streamlined user access, security, and reporting consistency.
- Scalable Reporting: The flexible architecture allowed the platform to easily incorporate new metrics and reporting needs.
- Enhanced User Engagement: The visual insights increased buyer confidence, resulting in higher participation rates on the platform.
Technology Environment
- Visualization: Tableau Desktop, Tableau Server
- Database: MS SQL Server
- Real Estate Analytics Dashboard Implementation
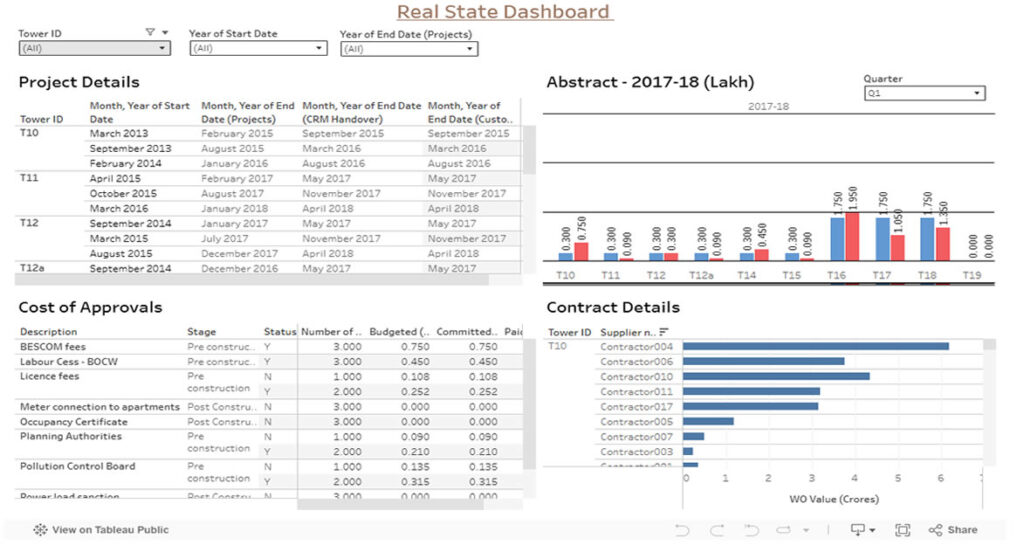
Executive Summary
A leading real estate development and investment company implemented a comprehensive Tableau-based analytics dashboard solution to transform their data-driven decision-making capabilities across multiple departments. The initiative addressed critical challenges in data fragmentation, manual reporting processes, and lack of real-time visibility into business operations, delivering significant ROI and competitive advantages.
About the Organization
The Challenge
- Critical business data scattered across multiple systems and platforms
- Excel-based reporting processes consuming 15-20 hours per week per department
- Risk of human errors in data compilation and analysis
- Delayed insights leading to missed opportunities in fast-moving real estate market
- No real-time tracking of project milestones and budget adherence
- Challenges in monitoring sales pipeline and conversion rates
- Lack of visibility into marketing campaign effectiveness
- Executive leadership lacked comprehensive operational dashboards for strategic decision-making
Solution
The organization implemented a multi-tiered Tableau dashboard solution encompassing five key areas:
Sales Performance Dashboard- Real-time sales metrics: property listings, sales volume, conversion rates
- Agent performance tracking and pipeline management
- Customer analytics and geographic performance analysis
- Campaign performance and ROI tracking across all channels
- Lead generation metrics with source attribution and quality scoring
- Website analytics and social media performance monitoring
- Timeline tracking with project milestones and delivery schedules
- Budget vs. actual financial performance monitoring
- Resource allocation and risk assessment capabilities
- Revenue analysis at property-level and portfolio performance
- Expense tracking, cash flow management, and investment ROI metrics
- Budget variance analysis and predictive financial modeling
- Consolidated KPIs across all departments
- Market intelligence and competitive analysis
- Strategic metrics for long-term growth and investor reporting
Business Impact
- 75% reduction in time spent on manual reporting processes
- 60% faster monthly close cycles through automated financial reporting
- 40% improvement in data accuracy and consistency across departments
- 50% reduction in ad-hoc data requests to IT department
- 25% increase in sales conversion rates through improved lead tracking
- 30% growth in average deal size due to better customer insights
- 40% increase in marketing campaign effectiveness
- 25% reduction in customer acquisition costs
- 20% reduction in sales cycle length via enhanced pipeline management
- 20% improvement in project delivery timelines
- 15% reduction in project budget overruns
- 18% increase in overall profit margins through better cost management
- 22% improvement in portfolio ROI tracking and optimization
- 30% faster financial decision-making through real-time insights
- Enhanced Decision-Making: Real-time access to critical business metrics enabling agile decision-making
- Improved Stakeholder Communication: Standardized investor reporting reducing preparation time by 60%
- Competitive Advantage: Faster response to market opportunities and better understanding of customer preferences
- Cultural Transformation: Data-driven culture adoption across the organization
Implementation Approach
- Stakeholder interviews and requirements gathering
- Data source identification and technical architecture design
- Project team formation and initial training
- Dashboard development with iterative testing
- Data integration and validation processes
- User acceptance testing and comprehensive training programs
- Production deployment with performance optimization
- Continuous improvement based on user feedback
- Advanced analytics and machine learning integration
- Scalability enhancements for future growth
Key Success Factor and Lessons Learned
- Executive Sponsorship: Strong leadership support was crucial for organization-wide adoption
- User-Centric Design: Involving end-users in design process ensured practical functionality
- Data Quality Focus: Investing in data cleansing and validation prevented future issues
- Phased Approach: Gradual rollout allowed for learning and adjustment during implementation
- Established clear data governance policies and procedures
- Implemented robust security and access control measures
- Created a center of excellence for ongoing dashboard management
- Prioritized comprehensive user training and change management
- Advanced Predictive Analytics: Machine learning models for market forecasting and risk assessment
- IoT Integration: Smart building data integration for operational optimization
- External Data Enhancement: Third-party market data and economic indicators integration
- AI-Powered Insights: Automated anomaly detection and recommendation engines
Conclusion
The Tableau-based real estate analytics dashboard implementation delivered transformative results across all business dimensions, demonstrating measurable ROI through:
- Operational Excellence: 75% reduction in manual reporting time and 40% improvement in data accuracy
- Revenue Growth: 25% increase in sales conversion rates and 30% growth in average deal size
- Cost Optimization: 25% reduction in customer acquisition costs and 18% increase in profit margins
- Strategic Advantage: Enhanced decision-making capabilities and competitive market positioning
The comprehensive approach to dashboard development, focusing on user needs and business outcomes, positioned the organization for sustainable competitive advantage through enhanced data-driven decision-making capabilities. This case study demonstrates the transformative power of well-implemented business intelligence solutions in the real estate industry, providing a blueprint for organizations seeking to leverage data analytics for operational excellence and strategic growth.
The solution not only addressed immediate operational challenges but also established a foundation for future innovation through advanced analytics, predictive modeling, and AI-powered insights, ensuring continued value realization and competitive advantage in the dynamic real estate market.
- Project Status Tracking and Performance Visualization
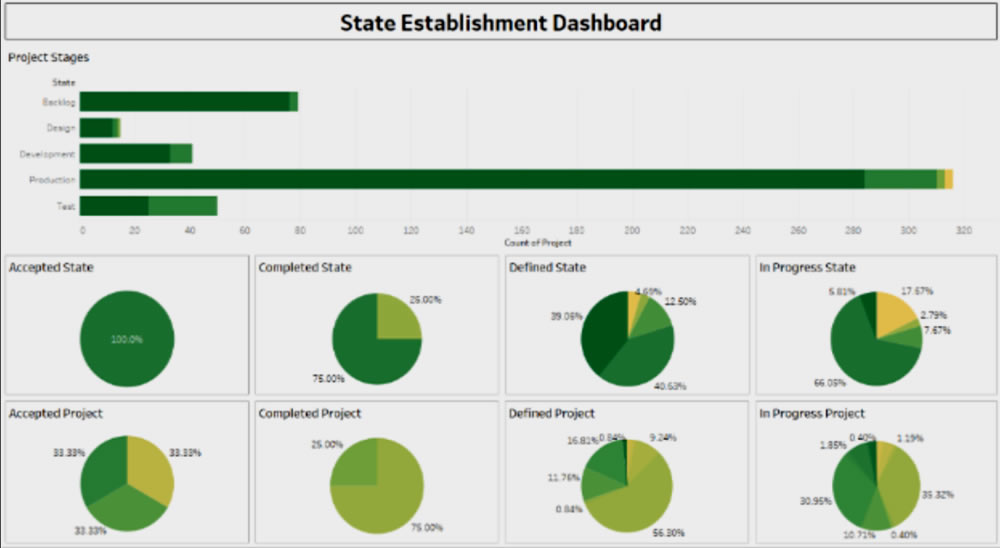
The Challenge
- How projects were progressing through different stages (Backlog, Design, Development, Production, Testing).
- The percentage of work completed, in progress, or delayed.
- Consolidation of data coming from multiple systems into a single, actionable view.
Scope
Key objectives:
- Consolidate data from multiple sources into a standardized reporting format.
- Provide visibility into project stages and departmental performance.
- Automate reporting to reduce manual effort and human error.
- Deliver actionable insights for better resource allocation and planning.
Solution
A Tableau-based analytics solution was implemented to address these challenges:
- Dashboard Design & Implementation
- Built interactive dashboards in Tableau Desktop to visualize project progress.
- Created tabular reports and integrated them into dashboards for quick insights.
- Displayed project stages (Backlog, Design, Development, Production, Testing) with real-time status tracking.
- Developed KPIs to show project percentages (Accepted, Completed, Defined, In-Progress).
- Data Integration & Cleansing
- Integrated multiple data sources into a single, centralized platform.
- Conducted extensive data extraction, transformation, and cleansing to ensure accuracy.
- Deployment & Scalability
- Published dashboards to Tableau Server for enterprise-wide access.
- Enabled drill-down analysis for department-level performance tracking.
Business Impact
Impact Area | Results Achieved |
Project Visibility | Achieved complete visibility of all projects across departments, improving transparency. |
Decision-Making | Reduced time to identify project delays and bottlenecks, enabling faster resource allocation. |
Operational Efficiency | Eliminated manual project tracking processes, saving 40% of reporting effort. |
Data Accuracy | Improved reporting accuracy through automated data integration and cleansing. |
Performance Monitoring | Real-time project metrics allowed leadership to track growth and project health at any time. |
Cross-Team Collaboration | Created a unified source of truth, improving communication and accountability between departments. |
Technology Environment
- Visualization & Analytics: Tableau (core dashboard platform).
- Data Sources: MES, ERP, SCADA, Quality Systems.
- Data Integration: ETL pipelines for real-time feeds.
- Database: SQL-based storage for structured production and quality data.
- Travel & Tourism Industries
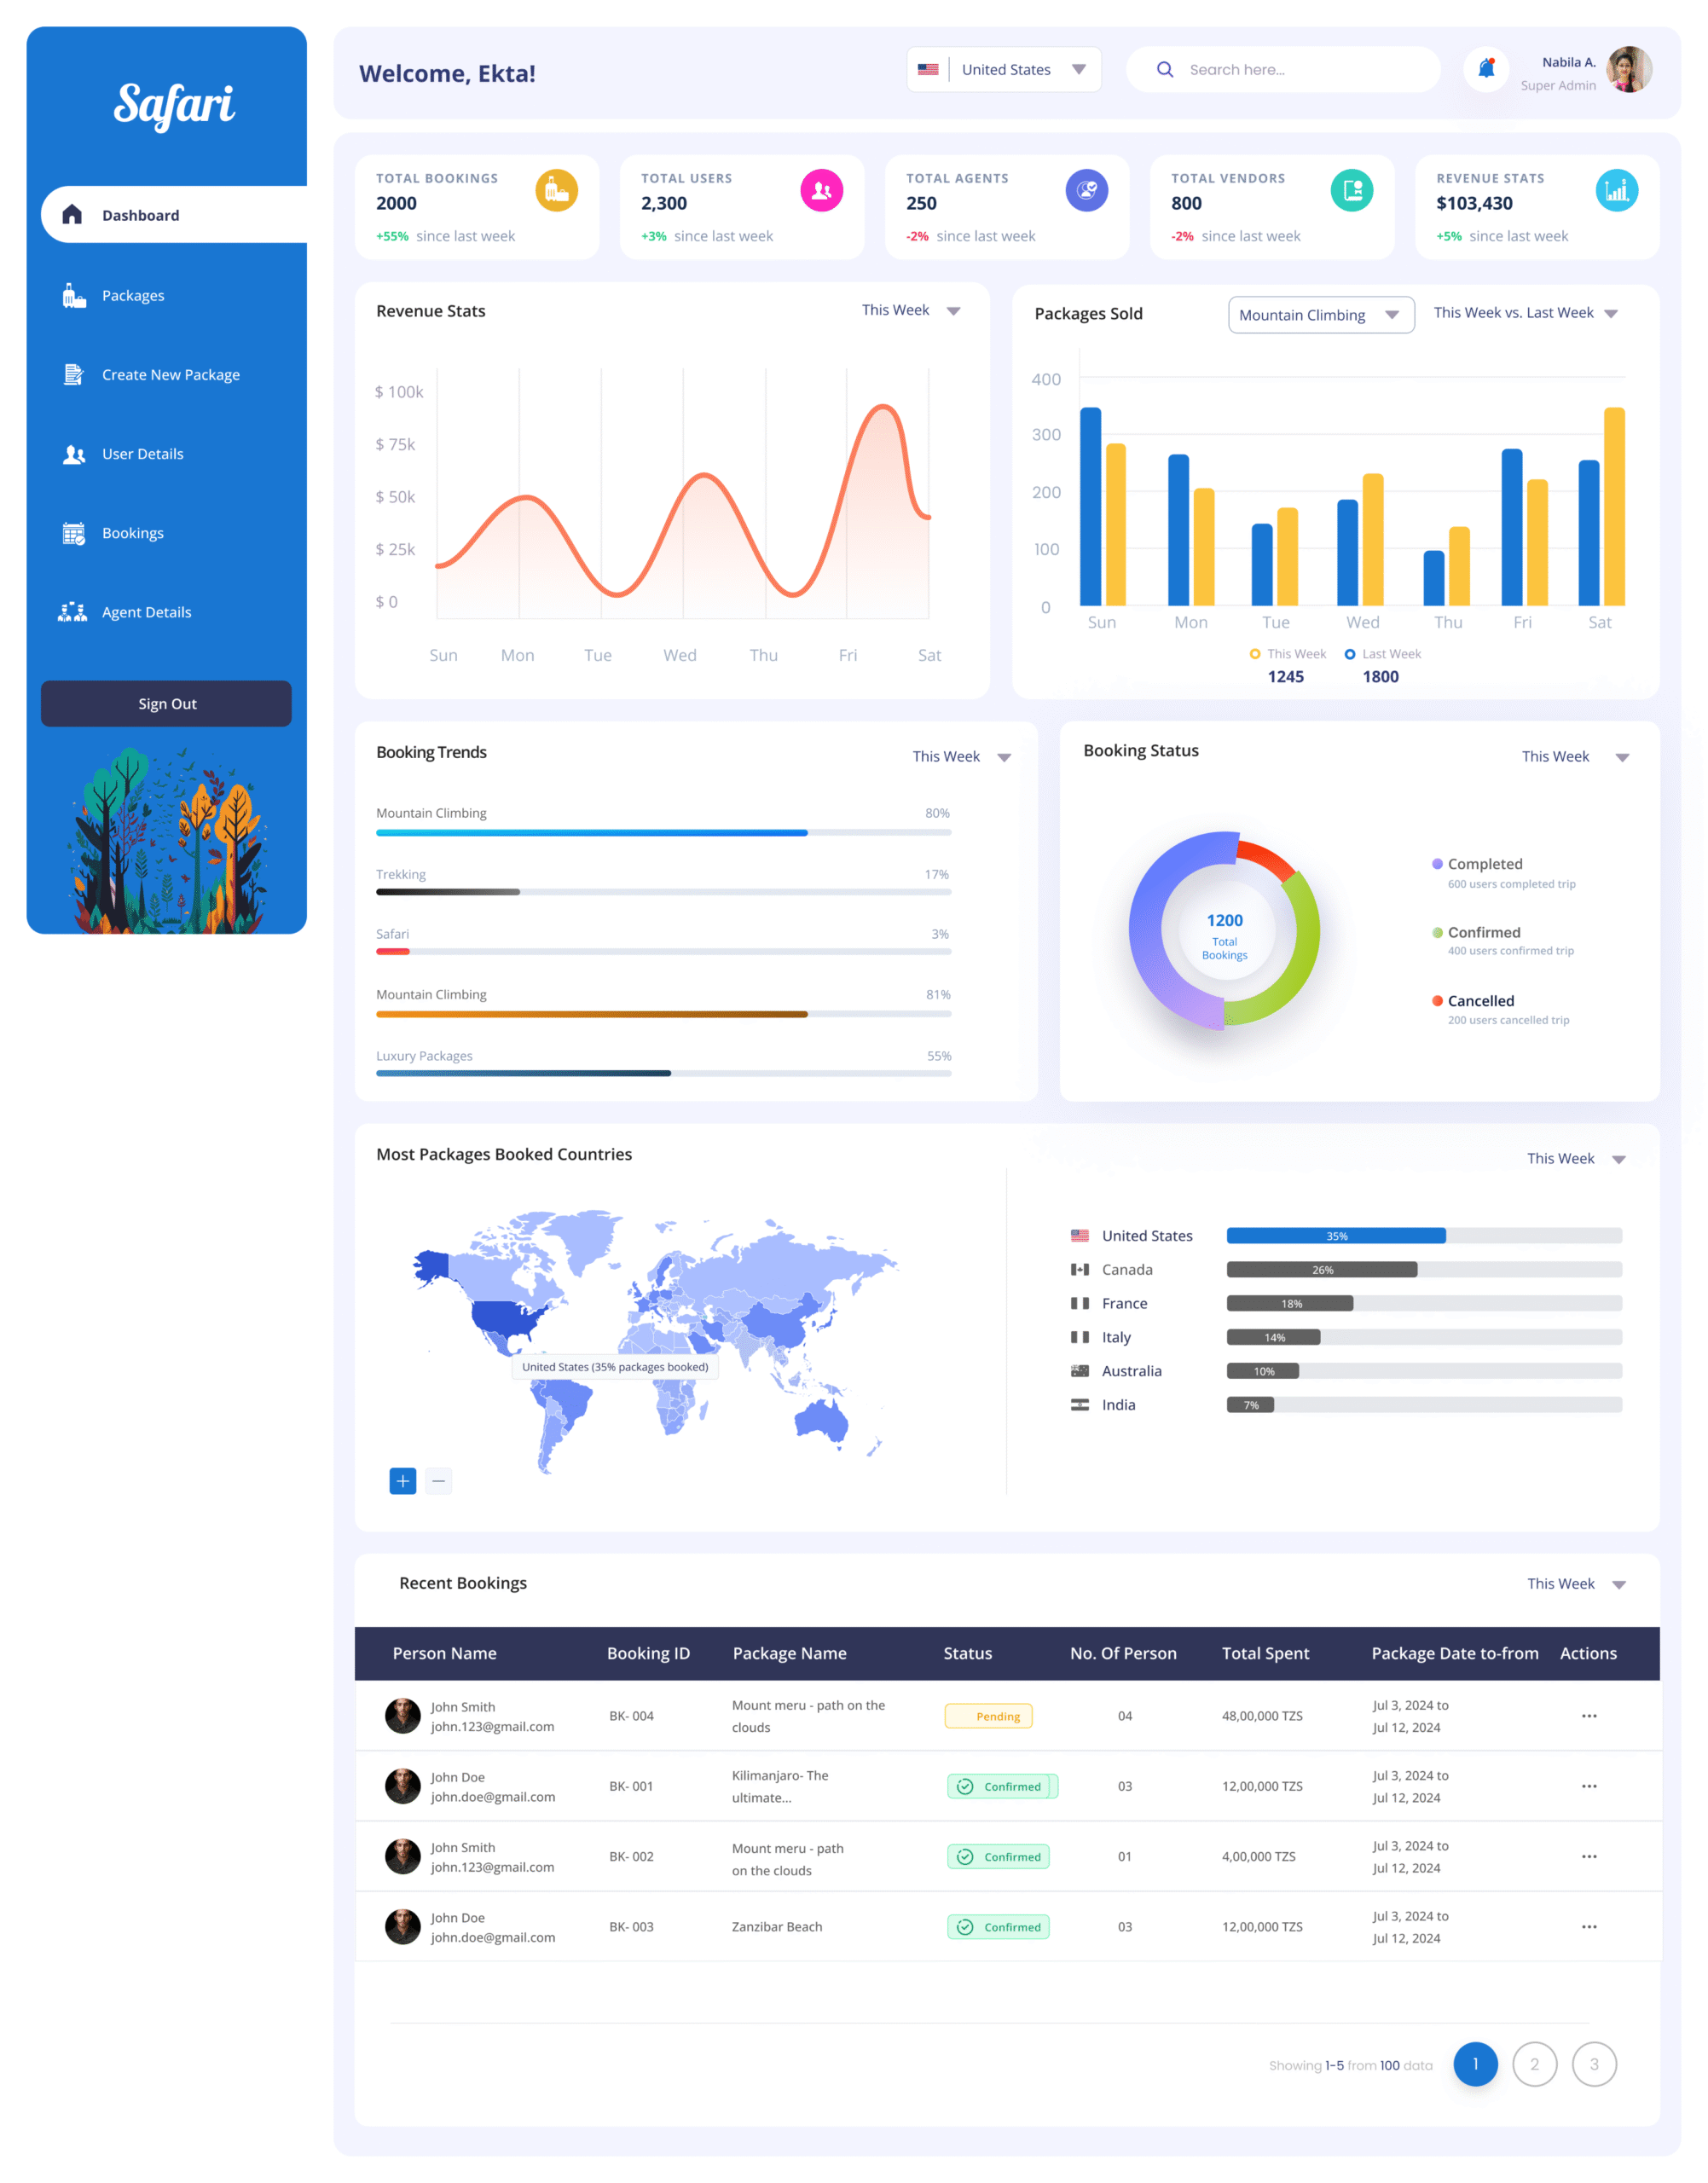
The Challenge
- The client required a modern, centralized platform to manage the entire travel ecosystem—including package creation, agent management, user tracking, booking monitoring, and revenue insights. The challenge was to simplify a multi-role, data-intensive workflow into an interface that remained clean, informative, and scalable for future features.
Scope Of Project
- Design a unified dashboard for Admins and Super Admins to monitor all travel operations.
- Provide modules to manage packages, agents, users, vendors, and bookings.
- Visualize booking and revenue performance trends.
- Integrate location-wise analytics to determine top-performing regions.
- Enable intuitive workflows for package creation and status monitoring.
The Solution
- Dashboard Overview Panels
- Designed top summary cards showing Total Bookings, Users, Agents, Vendors, and Revenue.
- Used color-coded indicators (+/-%) for week-over-week performance.
- Revenue & Package Performance Graphs.
- Implemented line charts for revenue stats and bar charts for packages sold—segmented by travel types (e.g., Mountain Climbing, Safari).
- Enabled toggle between “This Week” and “Last Week” comparisons.
- Real-Time Booking Tracker
- Used pie charts to visualize booking status (Completed, Confirmed, Cancelled).
- Booking trends displayed using horizontal bars for percentage breakdowns by package.
- Recent Bookings Table
- Included columns for Booking ID, Package Name, Status, Persons, Total Spent, Date Range.
- Status tags (e.g., Pending, Confirmed) with visual indicators.
- Geo Insights Panel
- World map integration to visualize most booked countries.
- Country-wise booking data displayed with proportional bars.
- Navigation & Workflow Enhancements
- Sidebar navigation grouped by tasks: Create Package, Agent Details, User Details, Bookings.
- Added pagination in tables for handling large datasets efficiently.
- Search bar and country selector for quick filtering.
Technology USED
- Figma, Adobe XD for Mockups, Prototype, And Handoff
This is the heading
Lorem ipsum dolor sit amet, consectetur adipiscing elit. Ut elit tellus, luctus nec ullamcorper mattis, pulvinar dapibus leo.
- Credit Management Dashboard
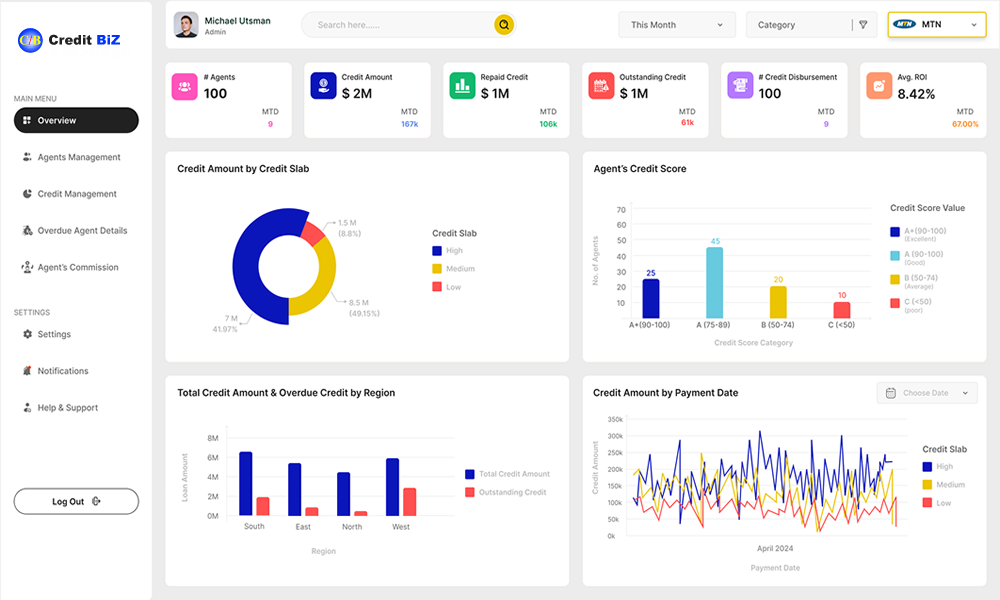
The Challenge
The client required a centralized platform to manage their microfinance credit ecosystem—including agent performance, credit disbursement, repayment tracking, defaulter monitoring, and commission insights. The main challenge was consolidating fragmented credit data and enabling real-time visibility into repayments, overdue credits, and portfolio risk while keeping the interface clean and scalable.
Scope of the Project
– Provide modules to manage agents, track credit disbursements, repayments, and commissions.
– Enable defaulter identification with overdue and repayment trend tracking.
– Integrate regional and risk-based analytics to monitor performance variations.
– Design workflows for real-time monitoring and proactive intervention.
The Solution
– Summary cards for Total Agents, Credit Issued, Amount Repaid, Outstanding Amount, Disbursements, and ROI.
– Color-coded indicators for MTD performance tracking.
Credit & Risk Analytics
– Donut and bar charts for credit distribution by risk slabs (High, Medium, Low).
– Time-series graphs for repayment trends and overdue amounts.
Defaulter Tracking
– Automated alerts for overdue repayments.
– Drill-down views to identify high-risk agents and borrowers.
Agent & Commission Management
– Agent scorecards with performance ratings (A+ to C).
– Commission tracking linked to disbursement and repayment success.
Regional Insights
– Maps and charts showing credit distribution and overdue patterns by region.
– Comparative analysis to identify underperforming areas. Navigation & Workflow Enhancements
– Sidebar navigation for Credit Management, Agent Details, Defaulter List, and Reports.
– Search and filters for quick access to agent or regional data.
– Pagination and export options for handling large datasets.
Business Impact
– Better Risk Management: Early detection of defaulters lowered credit default rates by 25%.
– Increased Transparency: Real-time monitoring boosted trust between supervisors and agents.
– Revenue Growth: Smarter commission tracking increased agent performance and repayment rates.
– Scalability: A future-ready system that can expand with growing credit portfolios.
Technology Used
- – React.js
- – Django Rest Framework
- Healthcare
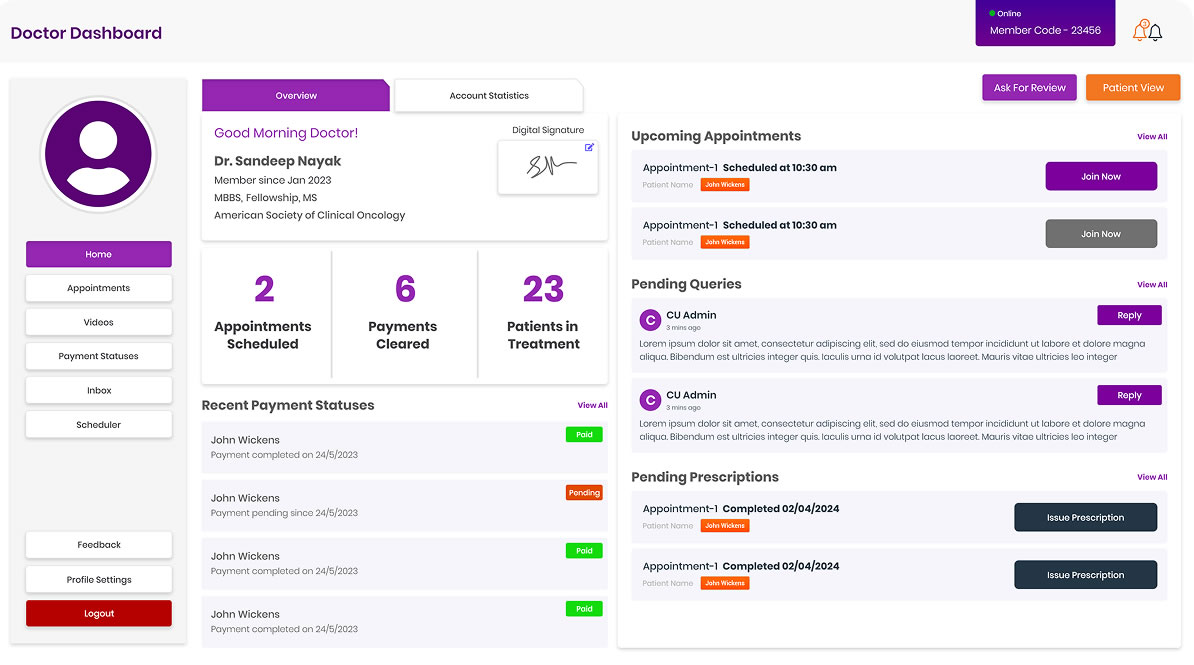
The Challenge
Building this solution involved navigating multiple complexities. The system required seamless integration of AI-driven conversations with real-time human intervention, especially in oncology-related queries, where accuracy and empathy were equally critical. Designing a scheduling and consultation engine that could adapt across time zones, prevent conflicts, and still offer flexibility for rescheduling was demanding. Ensuring secure video consultations with features like waiting lobbies, chat, and recording added another layer of intricacy. Beyond functionality, safeguarding patient data under strict compliance frameworks meant encryption, consent validation, audit logs, and role-based controls had to be tightly woven into the architecture. Scaling the platform to handle growing user volumes while maintaining low latency, reliable performance, and extensibility for future AI-driven insights further amplified the challenge. Above all, achieving a balance between patient empowerment, specialist efficiency, and administrative transparency required meticulous design and rigorous development efforts.
Scope of the Project
The solution was envisioned to deliver:
- Centralized Role Management for patients, experts, and administrators.
- Conversational AI Integration to provide accurate responses and route sensitive cases to experts.
- Scheduling & Consultation Engine supporting real-time availability, bookings, reminders, and video sessions.
- Operational Dashboards with KPIs, revenue analytics, appointment trends, and compliance-ready reporting.
- Specialized Cancer Care Support with oncology-focused expert recommendations, treatment reminders, and query insights.
- Data Security & Compliance with encryption, audit logs, and role-based access controls.
- Scalability & Future Readiness through modular design, real-time updates, caching, and AI extensions.
The Solution
Adminstration & Oversight
- Unified dashboard displaying KPIs such as active users, expert availability, appointments, and revenues.
- Real-time monitoring of registrations, bookings, cancellations, and user activity.
- Drill-down analytics into patient queries (including cancer-specific concerns), consultation outcomes, and expert performance.
- Configurable reports for compliance audits, revenue reconciliation, and trend analysis.
Patient Engagement
- Conversational AI delivering empathetic, real-time responses, backed by expert validation.
- Repository of queries used to build FAQs and identify health trends.
- Escalation mechanism for complex or sensitive queries (e.g., oncology-related) to connect patients directly with specialists.
- Multi-language support for inclusivity and accessibility.
Expert Tools
- Enterprise-grade scheduling engine with recurrence rules, conflict prevention, and timezone accuracy.
- Status-aware booking workflows (Available, Booked, Pending, Cancelled, Rescheduled).
- Integrated video consultations with secure join tokens, lobbies, chat, screen sharing, recording, and host controls.
- Automated notifications and reminders for both experts and patients.
- Oncology-specific workflows for follow-ups, therapy sessions, and multidisciplinary team meetings.
Security & Compliance
- Role-Based Access Control across patients, experts, and admins.
- Consent verification before consultations, especially critical for cancer treatment.
- Encrypted data storage, scoped tokens, audit logs, and PII minimization.
- Protection mechanisms such as CSRF prevention, rate limiting, and timezone normalization.
Data & Insights
- Revenue analytics with monthly and yearly comparisons.
- Query aggregation to identify common health concerns and oncology-specific needs.
- Predictive analytics for patient demand, expert allocation, and cancer care resource planning.
- Anomaly detection for unusual activity patterns, cancellations, or treatment interruptions.
- AI-driven admin assistant for generating reports, surfacing insights, and suggesting actions.
Business Impact
- Empowered Patients: 24/7 access to general and cancer-specific healthcare guidance reduced unnecessary visits and improved confidence in care.
- Specialized Cancer Support: Patients gained priority access to oncologists, reliable information on treatment and side effects, and streamlined follow-ups.
- Optimized Expert Workflows: Scheduling automation, reminders, and repetitive query handling freed up specialists to focus on critical cases.
- Transparent Operations: Real-time dashboards and compliance-ready reports improved oversight and accountability.
• Operational Efficiency: Reduced manual interventions and improved coordination between patients, experts, and administrators. - Future-Ready Growth: Scalable and modular architecture positioned the platform for predictive analytics, AI-driven automation, and integration with cancer research databases.
- Trust & Security: Strong compliance measures and audit trails reinforced confidence among patients, experts, and regulators.
Technology Used
- Frontend: React, Next.js, Bootstrap for responsive and accessible UI.
- Backend: Python with Django (DRF framework, microservices as needed).
- Database: MySQL (for structured data).
- Authentication & Security: NextAuth, JWT, OAuth2, Role-Based Access Control, encryption libraries.
- Video Consultations: Zoom SDK, WebRTC, Socket.IO for real-time communication.
- AI/ML Integration: OpenAI API, additional NLP models (for video transcription & analysis), Python packages for model integration.
- Analytics & Reporting: Custom dashboards with Chart.js/Recharts.
- Infrastructure & Scalability: AWS EC2, AWS S3.
- Notifications & Scheduling: Cron jobs, AWS SNS (SMS), ZeptoMail (Email).
- Developing a Unified Sales Tracking Dashboard for a Leading Radio Station
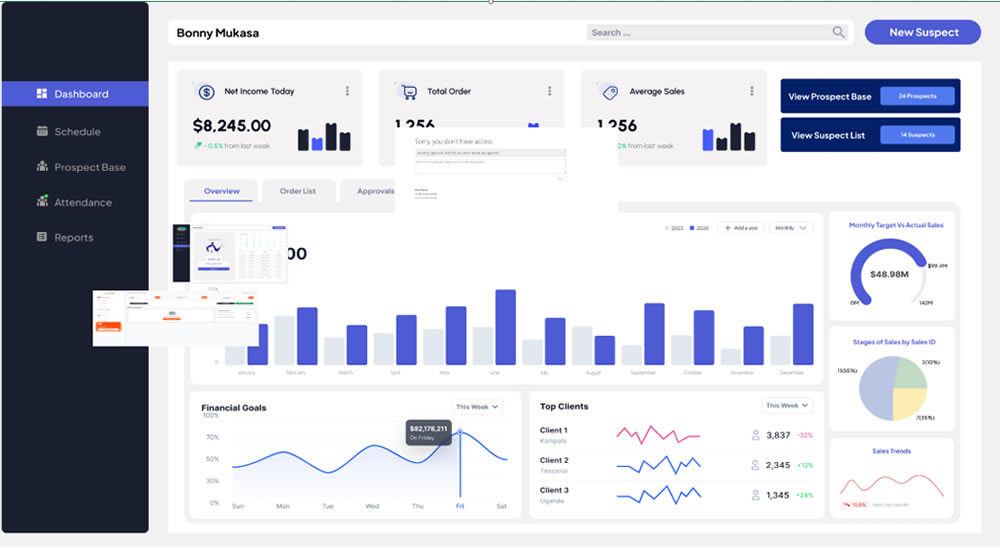
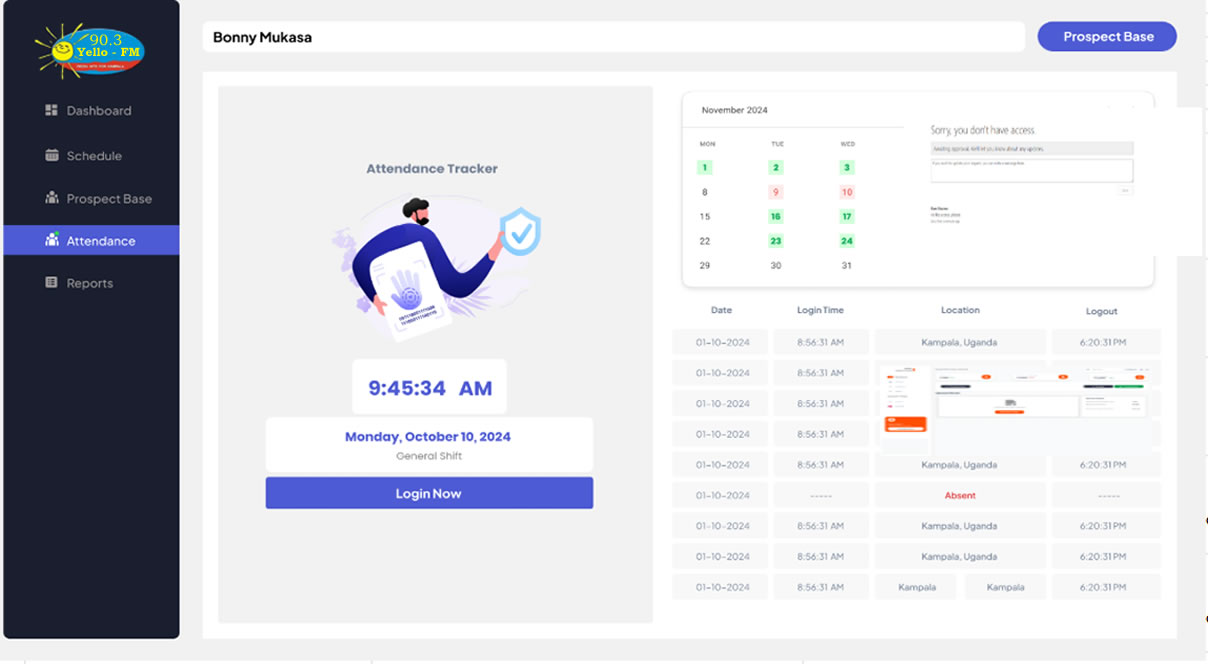
Industry
Our team developed a sophisticated, multi-level sales tracking dashboard for a major player in the broadcast media industry. The goal was to centralize sales data, streamline operations, and provide role-specific insights across their entire sales hierarchy, from individual representatives to executive management.
The Challenge
The client’s sales organization operated with multiple channels, each managed by a dedicated sales manager and a team of salespeople. The primary challenge was a lack of a unified system to track sales performance, employee activities, and revenue generation across different levels of the hierarchy.
Key issues included:
- Fragmented Data: There was no central platform for viewing consolidated sales data, making it difficult for the Head of Sales to get a holistic view of the entire operation.
- Inefficient Management: Sales managers lacked the tools to effectively monitor their team’s performance, track lead pipelines, manage schedules, and ensure productivity in the field.
- Limited Salesperson Tools: Sales representatives needed a dedicated portal to manage their leads, log sales activities, track their progress against targets, and schedule client meetings efficiently.
Scope of the Project
The project’s objective was to design and implement a comprehensive sales dashboard with distinct functionalities tailored to three user roles: Salesperson, Manager, and Head of Sales.
The scope included developing three interconnected dashboards:
- Salesperson Portal: A personalized dashboard for individual sales reps to manage their leads through every stage of the sales pipeline, view performance KPIs, access a scheduler for client meetings, and log daily attendance.
- Manager Dashboard: A consolidated view for sales managers to track their team’s overall performance, monitor aggregated KPIs, forecast revenue based on the team’s pipeline, and manage schedules. It also included features for tracking team member attendance and field activities.
- Head of Sales Dashboard: A high-level executive dashboard providing a complete overview of all sales channels and managers. This view allows senior management to monitor company-wide performance, compare channel results, and make strategic, data-driven decisions.
The Solution
- Empowering Sales Representatives: The individual salesperson portal acts as a daily command center. It features lead and opportunity management, automated reminders for follow-ups, and clear visualizations of performance against targets, boosting personal accountability and efficiency.
- Enabling Proactive Management: Managers can now access a unified dashboard to see their team’s consolidated sales pipeline, track real-time activity, and view attendance logs. The system allows them to balance workloads by reassigning leads and approve deals directly within the platform, enhancing team productivity and agility.
- Providing Strategic Oversight: For the Head of Sales and top executives, the dashboard offers a powerful analytics tool. With drill-down capabilities, they can move from a high-level overview to the performance details of a specific channel, manager, or even an individual salesperson, ensuring complete visibility and control.
Business Impact
- Increased Sales Efficiency: By automating task management and providing a clear view of leads, sales reps can focus more on selling and less on administrative tasks, leading to shorter sales cycles and higher close rates.
- Improved Revenue Predictability: With a consolidated pipeline and historical data analysis, managers and executives can generate more accurate revenue forecasts, enabling better financial planning and resource allocation.
- Enhanced Managerial Effectiveness: Managers gained the ability to monitor team performance in real time, identify top and bottom performers, and provide targeted coaching. The ability to manage schedules and reassign leads ensures continuous productivity.
- Data-Driven Strategic Decisions: Executive leadership can now make informed decisions based on comprehensive, real-time data on channel performance and market trends, rather than relying on disparate reports.
- Greater Accountability and Motivation: Personalized KPIs and transparent performance tracking have fostered a culture of accountability, motivating sales reps to meet and exceed their targets.
Technology Used
- Library Management System Case Study
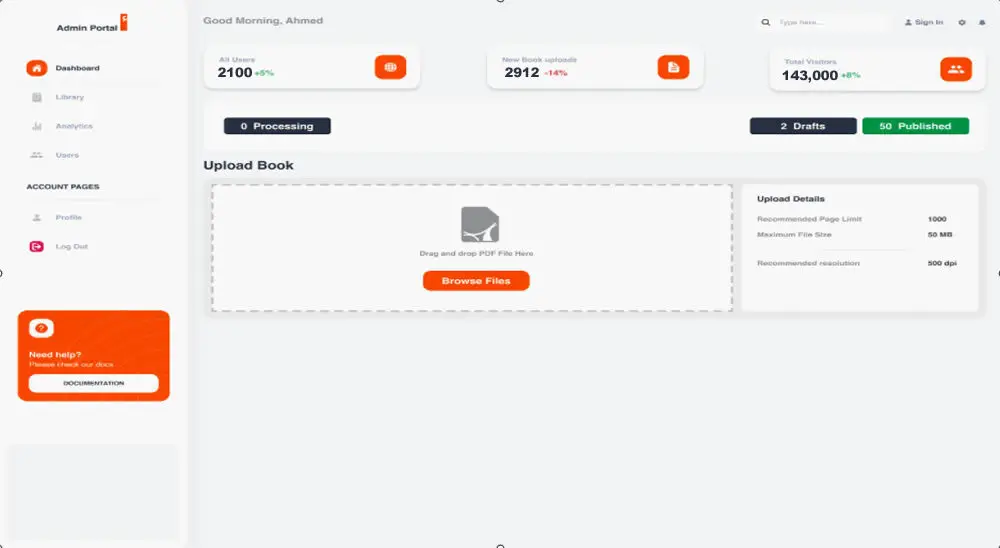
The Challenge
The client required a modern, centralized platform to manage digital books—including uploading PDFs, converting them into readable text, generating audiobooks, and providing seamless access for users to save, read, or listen later. The main challenge was to simplify a multi-step workflow (upload → convert → save → access) into a clean, intuitive, and scalable interface.
Scope of the Project
– Enable PDF uploads with support for large files and multiple formats.
– Provide automatic conversion of PDF files into text and audio (text-to-speech).
– Create modules to save, organize, and categorize books.
– Enable users to listen to audiobooks directly from the platform.
– Provide analytics on uploads, user activity, and library growth.
The Solution
– Summary cards showing Total Users, Total Books Uploaded, and Total Visitors.
– Indicators for percentage changes (+/-%) in uploads and user engagement.
Book Upload & Conversion
– Drag & drop upload area with support for PDF files.
– Upload details panel showing recommended limits (page size, file size, resolution).
– Automatic PDF → Text → Audio conversion pipeline.
Library & Book Management
– Dedicated Library section to view, search, and filter uploaded books.– Save and categorize books by genre, author, or user-defined tags.– Status indicators for uploaded books (Processing, Draft, Published).
Audiobook Features
– In-browser audio player for listening to converted books.– Ability to pause, bookmark, and resume playback.– Download option for offline listening.
Analytics & Insights
– Charts and metrics to show most-read books, top listeners, and upload trends.– Activity breakdown by users and regions. Navigation & Workflow Enhancements
– Sidebar navigation for Dashboard, Library, Analytics, Users, and Profile.– Help & Support section for quick documentation access.– Search bar for finding books or users instantly.
Business Impact
Technology Used
- Event Management System – User, Host & Admin Platform


The Challenge
The client required a complete event management ecosystem with three integrated modules: a user-facing mobile app, a host-facing mobile app, and an admin web application. The challenge was to streamline the end-to-end event lifecycle—from ticket booking and payments to on-ground QR code validation and revenue tracking—while ensuring real-time updates, secure payments, and a smooth user experience.
Scope
- User Mobile App:
- Registration, login, and access to personalized dashboards.
- Explore upcoming events, apply filters, view event details, and add to wishlist.
- Book event tickets for self and family members via Razorpay.
- Share billing details and QR codes for entry validation.
- Receive push notifications for booking confirmations and updates.
- Host Mobile App (Scanner App):
- Event organizers can scan user QR codes for entry validation.
- Real-time check-in tracking with per-head calculations.
- Send instant push notifications to users regarding ticket validation.
- Admin Web Application:
- Manage events, users, and hosts from a centralized panel.
- Track ticket sales, bookings, and revenue.
- Access real-time analytics with statistics and graphical reports.
- Monitor event performance and ensure security compliance.
Solution
- Registration & Login with secure authentication.
- Event Browsing with search, filters, and detailed event descriptions.
- Ticket Booking & Payments via Razorpay with multi-member booking support.
- QR Code Generation for each booking, sharable with family members.
- Booking History & Wishlist for easy tracking of past and upcoming events.
- Notifications for booking confirmations, reminders, and updates.
- QR Code Scanner for validating user entry.
- Real-time Validation with per-head attendance tracking.
- Instant Notifications sent to users upon validation.
- Event Management Tools for quick on-ground coordination.
- Event Creation & Management: Add, update, or remove events.
- Revenue & Ticket Insights: Track bookings, revenue, and refunds.
- Analytics & Reports: Visual statistics with graphs for performance monitoring.
- User & Host Management: Verify hosts, monitor users, and manage access rights.
Business Impact
- Enhanced User Experience: Simplified booking and family-inclusive ticketing increased participation.
- Secure Event Entry: QR-based validation minimized fraud and ensured smooth entry.
- Revenue Transparency: Admin dashboard improved financial tracking and decision-making.
- Operational Efficiency: Real-time scanning and notifications streamlined event check-ins.
- Scalability: Future-ready system to support large-scale events across multiple regions.
Technology Environment
- React Native – Mobile applications for users and hosts.
- React.js – Admin web dashboard for event and revenue management.
- Django Rest Framework (DRF) – Backend APIs with business logic.
- MySQL – Database for users, events, bookings, and transactions.
- Razorpay – Secure payment gateway integration.
- Push Notifications (Firebase) – Real-time booking confirmations and validation alerts.
- QR Code System – Secure entry validation and per-head attendance tracking.
- Travel Safari


Industry
Our team developed a sophisticated, multi-level sales tracking dashboard for a major player in the broadcast media industry. The goal was to centralize sales data, streamline operations, and provide role-specific insights across their entire sales hierarchy, from individual representatives to executive management.
The Challenge
the client wanted to build a competitive, modern alternative that could simplify the fragmented travel booking experience. The vision was to create a centralized ecosystem where everything—package creation, agent management, customer bookings, payments, and revenue tracking could be managed seamlessly. The challenge was not just technical but also experiential: how to consolidate multi-role workflows and heavy data operations into a platform that felt effortless to use. The interface needed to remain simple for end-users booking trips, yet powerful enough for agents and administrators to manage complex operations. At the same time, the solution had to be future-ready, scalable for new features, and capable of delivering actionable insights to drive business growth.
Scope of the Project
The project was designed to serve two primary user groups: administrators/agents and end customers.
Admin & Superadmin Dashboard
- A unified dashboard to oversee all travel operations in real time.
- Modules for managing travel packages, agents, users, vendors, and bookings.
- Visualization tools to track booking volumes and revenue performance.
- Location-wise analytics to identify top-performing regions and optimize offerings.
- Streamlined workflows for package creation, approval, and status monitoring.
User-Facing Mobile Application
- A customer-centric mobile app for seamless travel booking.
- Secure login and profile setup for personalized experiences.
- Simple, guided workflows for browsing and booking packages.
- Integrated payment flow to confirm bookings instantly.
- Travel-ready features to support customers before and during their journey.
The Solution
Dashboard Overview Panels We created top-level summary cards highlighting key metrics such as Total Bookings, Users, Agents, Vendors, and Revenue. Each card included color-coded performance indicators (+/–%) to give admins quick week-over-week insights at a glance.
Revenue & Package Performance Graphs
For deeper visibility, revenue trends were represented using line charts, while package sales were shown as bar charts segmented by travel types (e.g., Mountain Climbing, Safari). Admins could switch between “This Week” and “Last Week” to compare performance instantly.
Real-Time Booking Tracker
A real-time booking visualization was introduced using pie charts to display booking statuses (Completed, Confirmed, Cancelled). Horizontal bar charts further broke down booking trends by package, providing actionable insights on customer preferences.
Recent Bookings Table
A detailed bookings table included Booking ID, Package Name, Status, Number of Persons, Total Spent, and Date Range. Status tags (Pending, Confirmed, Cancelled) were paired with visual markers for clarity and faster decision-making.
Geo Insights Panel
To help identify demand hotspots, we integrated an interactive world map showing the most-booked countries. Country-wise booking data was displayed with proportional bars, allowing admins to track regional performance effortlessly.
Navigation & Workflow Enhancements
The overall workflow was made more intuitive with sidebar navigation grouped by tasks such as Package Creation, Agent Details, User Details, and Bookings. Pagination was added to handle large datasets efficiently, and a global search bar with a country selector was introduced for quick filtering and faster navigation.
Business Impact
The Travel Safari platform transformed the way travel operations were managed by consolidating fragmented workflows into a unified ecosystem. The streamlined dashboards and real-time analytics empowered administrators to make faster, data-driven decisions, while the mobile application offered customers a seamless, modern booking journey.
Key business outcomes included:
- Operational Efficiency – Centralized dashboards reduced manual overhead for agents and admins, cutting down time spent on managing packages, users, and bookings.
- Improved Decision-Making – Visual insights on revenue trends, regional demand, and booking performance enabled data-backed strategic planning.
- Enhanced User Experience – The mobile app delivered a simple, guided booking flow, leading to higher customer satisfaction and improved trust.
- Scalability for Growth – A future-ready architecture allowed the platform to accommodate new travel categories, partners, and analytics features as business needs evolve.
- Competitive Edge – By combining intuitive design with robust operations, the platform positioned the client to compete with larger players like MakeMyTrip while focusing on niche experiences and tailored offerings.
Technology Used
- Figma, Adobe XD for Mockups, Prototype, And Handoff
- Nextjs
- Auto Booking & Travel Management App


The Challenge
The client needed a reliable and user-friendly mobile platform for connecting passengers with auto driver similar to Ola or Uber but tailored for local auto-rickshaw transportation. The challenge was to create a seamless booking experience, real-time ride tracking, and efficient communication between users, drivers, and the admin, while ensuring security through OTP verification and feedback mechanisms.
Scope of Project
- Develop a mobile app for Users to register, book rides, view history, and provide feedback.
- Create a mobile app for Drivers to accept bookings, receive notifications, and manage rides.
- Build an Admin Dashboard to manage users, drivers, ride history, and overall system monitoring.
- Enable real-time booking and tracking from the current or custom location to the destination.
- Provide ride history, reviews, and rating system for transparency and accountability.
The Solution
User App Features
- Registration & Login: Secure onboarding via email/phone.
- Booking Module: Book autos from current GPS location or a chosen location.
- Ride Tracking: Live status of driver acceptance, arrival, and trip progress.
- OTP Verification: Secure ride start validation using OTP.
- Ride History & Feedback: View past rides, give ratings, and submit reviews.
Driver App Features
- Driver Registration & Verification for onboarding.
- Real-time Notifications for new bookings.
- Ride Management: Accept or decline rides, track ongoing rides.
- Earnings & History: Access completed ride details and total earnings.
Admin Dashboard Features
- User & Driver Management: Monitor and verify registrations.
- Ride Tracking: Access real-time data of ongoing and completed trips.
- Booking & Payment Records: Manage ride history, cancellations, and payments.
- Feedback & Reviews: Track user ratings and driver performance.
Business Impact
- Improved Accessibility: Simplified auto booking process increased customer convenience.
- Driver Empowerment: Drivers received fair opportunities with transparent booking and earnings.
- Operational Efficiency: Centralized admin dashboard reduced manual intervention.
- Enhanced Trust & Security: OTP verification and reviews-built confidence among users.
- Scalability: The platform can expand to support multiple cities and advanced payment systems.
Technology USED
- React Native – Cross-platform mobile application development.
- React.js (Admin Panel) –Scalable and interactive dashboard interface.
- Django Rest Framework – Secure and efficient backend with APIs.
- MySQL – Robust relational database for storing users, drivers, and ride data.
- Google Maps API – Real-time location tracking and navigation.
- Firebase Notifications – Instant ride alerts and updates.
- E-Learning Platform – Online Learning & Student Management


The Challenge
The Solution
- Build a React.js student portal for registration, login, and course access.
- Develop an Admin Dashboard to upload video content, create quizzes, and manage students.
- Integrate Classplus platform for live one-on-one teacher-student interactions.
- Provide a secure payment gateway (Razorpay) for course enrollment.
- Track student progress, weekly tests, and quiz results in real time.
- Ensure scalability and seamless learning experience with video and interactive content.
The Solution
- Registration & Login: Secure student onboarding with profile management.
- Course Dashboard: Access to enrolled courses, video lessons, and quizzes.
- Payment Integration: Razorpay gateway for smooth and secure transactions.
- Classplus Integration: Direct link to live one-on-one teacher sessions.
- Progress Tracking: View test results, weekly performance, and learning milestones.
Admin Dashboard Features
- Content Management: Upload course videos, documents, and materials.
- Quiz Builder: Create quizzes with automatic evaluation and reporting.
- Student Management: Monitor registrations, payments, and course progress.
- Performance Reports: Weekly test results and student analytics for intervention.
- Classplus Integration: Sync content and sessions with Classplus platform.
Business Impact
- Increased Engagement: One-on-one learning via Classplus improved teacher-student interaction.
- Revenue Growth: Razorpay integration enabled seamless payments, boosting enrollments.
- Progress Visibility: Weekly test reports allowed teachers to intervene early.
- Efficient Content Delivery: Admins could easily upload and manage courses and quizzes.
- Future-Ready: Scalable platform to accommodate more students, courses, and features.
- Travel and Tourism
The Challenge
Scope Of Project
- Design a unified dashboard for Admins and Super Admins to monitor all travel operations.
- Provide modules to manage packages, agents, users, vendors, and bookings.
- Visualize booking and revenue performance trends.
- Integrate location-wise analytics to determine top-performing regions.
- Enable intuitive workflows for package creation and status monitoring.
The Solution
- Dashboard Overview Panels
- Designed top summary cards showing Total Bookings, Users, Agents, Vendors, and Revenue.
- Used color-coded indicators (+/-%) for week-over-week performance.
- Revenue & Package Performance Graphs.
- Implemented line charts for revenue stats and bar charts for packages sold—segmented by travel types (e.g., Mountain Climbing, Safari).
- Enabled toggle between “This Week” and “Last Week” comparisons.
- Real-Time Booking Tracker
- Used pie charts to visualize booking status (Completed, Confirmed, Cancelled).
- Booking trends displayed using horizontal bars for percentage breakdowns by package.
- Recent Bookings Table
- Included columns for Booking ID, Package Name, Status, Persons, Total Spent, Date Range.
- Status tags (e.g., Pending, Confirmed) with visual indicators.
- Geo Insights Panel
- World map integration to visualize most booked countries.
- Country-wise booking data displayed with proportional bars.
- Navigation & Workflow Enhancements
- Sidebar navigation grouped by tasks: Create Package, Agent Details, User Details, Bookings.
- Added pagination in tables for handling large datasets efficiently.
- Search bar and country selector for quick filtering.
The Impact on Business
- Faster Decision-Making
- Real-time dashboards give management instant visibility into bookings, revenue, and performance trends, enabling quick and data-driven decisions.
- Improved Sales & Revenue Tracking
- Revenue graphs and package performance insights help identify high-performing packages and underperforming ones, guiding targeted promotions and pricing adjustments.
- Enhanced Customer Experience
- Real-time booking tracking ensures faster issue resolution for pending/cancelled bookings, improving customer satisfaction and trust.
- Optimized Operations
- Geo insights reveal top-performing regions, helping the business allocate resources, marketing budgets, and vendor partnerships more effectively.
- Better Agent & Vendor Management
- Centralized data on agents, vendors, and bookings ensures transparency and accountability, reducing operational inefficiencies.
Technology Used
- Figma, Adobe XD for mockups, prototypes, and handoff
- Healthcare
The Challenge
- Patients were juggling calls, messages, and websites just to find a doctor and get an appointment, and many still arrived without the right records. Doctors started the day without a simple view of who was coming in and what each visit needed. Admins could not see reliable, real-time numbers on bookings, cancellations, or refunds. Cross-border patients added time-zones, languages, and payments to the mix, which made a simple visit feel complicated.
Scope Of Project
- Patient area with easy sign-up, clear profiles, doctor search by specialty and location, live availability, booking and rescheduling, reminders, and a place to keep prescriptions and reports
- Doctor area with profile and availability, a tidy list of upcoming visits, simple tools to consult, record notes, and issue prescriptions, plus a view of payouts
- Admin area to manage users and verifications, configure services and fees, track performance and revenue, handle cancellations and refunds, and keep the platform healthy
- Reading and listening hub with blogs and podcasts that help patients learn and prepare
- Messaging that keeps follow-ups in one place and reduces back-and-forth
- Payments that work smoothly for different regions with clear summaries and invoices
- Accessible, responsive design that works well on web and mobile
The Solution
- One booking flow that lets patients find the right doctor, see open slots in their own time-zone, and confirm in a few steps
- A single consultation screen with video, chat, file sharing, and easy-to-read prescriptions so both sides stay focused
- A personal “medilocker” where patients can store and reuse prescriptions, reports, and visit notes without digging through emails
- A day view for doctors that shows who is coming, what to prepare, and quick templates to finish documentation on time
- An admin command center with live numbers on conversions, no-shows, cancellations, refunds, and specialty performance, plus a clear audit trail
- Friendly reminders before and after visits that reduce missed appointments and nudge follow-ups
- Strong privacy practices with consent captured in-flow and data protected behind role-based access
- A consistent design system so every page feels familiar and easy to use
The Impact on Business
- People book faster and show up better prepared. Doctors spend less time chasing information and more time with patients. Admins finally see what is working and what needs attention, which helps steady revenue and cut avoidable refunds. The experience feels simple end to end, so patients come back, doctors stay engaged, and the platform is ready to expand to new regions and partners.
Technology Used
- Adobe XD for mockups, prototypes, and handoff
- Banking and Finance
The Challenge
- Difficulty in tracking agent credit performance across regions.
- Lack of real-time visibility into outstanding credit, repayments, and disbursements.
- Manual reporting causing delays in decision-making.
- No centralized way to assess agent risk levels (credit score, overdue amounts).
- Inconsistent monitoring of ROI and business growth trends.
Scope Of Project
- Build a centralized credit management dashboard for admins.
- Integrate key financial metrics: total credit, repayments, outstanding credit, ROI, disbursements.
- Provide visual insights into agent credit scores, credit slabs, and overdue trends.
- Enable region-wise performance tracking to identify high- and low-performing areas.
- Support real-time monitoring with customizable filters (time, category, region).
- Simplify navigation with modules for agents, credit, commissions, and overdue tracking.
The Solution
- Designed an interactive dashboard with summary cards, charts, and performance indicators.
- Added credit slab segmentation (High, Medium, Low) for risk monitoring.
- Implemented agent credit score analysis to assess reliability and repayment capacity.
- Built geo-based insights (region-wise breakdown of credit & overdue amounts).
- Integrated trend analysis graphs for revenue and repayment by date.
- Created navigation modules (Agents, Credit Management, Overdue Details, Commissions) for workflow efficiency.
- Added real-time filters (month, category, company/agent) for instant customization.
The Impact on Business
- Stronger Risk Management – Identifies high-risk agents early, reducing default chances.
- Data-Driven Decision-Making – Leaders can instantly assess ROI, credit distribution, and repayment performance.
- Improved Efficiency – Eliminates manual tracking, saving time for finance and operations teams.
- Enhanced Transparency – Clear visibility of credit utilization across regions builds accountability.
- Revenue Protection – Early detection of overdue credits helps prevent losses.
- Agent Performance Insights – Credit score categorization helps incentivize reliable agents and retrain underperformers.
- Scalability – System can handle growing agents, regions, and disbursements without complexity.
Technology used
- Figma, Adobe XD for mockups, prototypes, and handoff
- Event Management
The Challenge
- Event hosts struggled with manual tracking of registrations, tickets sold, and revenue.
- No real-time visibility into upcoming and past events, leading to poor planning.
- Lack of insights into unsold tickets and overall sales performance.
- Difficulty in managing multiple events and schedules efficiently.
Scope Of Project
- Build a centralized host dashboard for managing events, tickets, and revenue.
- Provide real-time analytics on ticket sales, registrations, and event performance.
- Enable hosts to track upcoming events, past events, and unsold tickets.
- Offer calendar integration for quick scheduling and event visibility.
- Provide user-friendly navigation for managing event details and ticketing.
The Solution
- Designed an intuitive dashboard showing total registrations, tickets sold, and revenue in real time.
- Implemented sales statistics charts (pie & progress bars) for visual insights.
- Added Upcoming Events & Latest Past Events panels with ticket availability and sales status.
- Integrated a calendar widget for hosts to manage scheduled events efficiently.
- Enabled quick navigation for past events, ticket details, and scheduled events.
- Provided alerts/notifications for new bookings and unsold tickets.
The Impact on Business
- Enhanced Event Visibility – Hosts can view registrations, sales, and performance at a glance.
- Improved Ticket Sales – Real-time monitoring of unsold tickets helps optimize promotions.
- Operational Efficiency – Automated tracking reduces manual effort and errors.
- Revenue Growth – Hosts can identify high-performing events and replicate success strategies.
- Better Planning – Calendar and sales data help schedule and market events more effectively.
- Customer Satisfaction – Faster responses to ticketing issues and smooth event management improve attendee experience.
Technology USED
- Adobe XD for mockups, prototypes, and handoff
- Talent Acquisition
The Challenge
- Clients and candidates were doing a lot of things in different places—creating projects, searching and shortlisting people, scheduling interviews, onboarding, sharing files, reviewing work, and handling payouts—without one clear path from start to finish. Money terms were easy to mix up (project balance, add funds, payment method), interviews could be missed without a friendly scheduler, and the “what happens after the call?” step wasn’t obvious. Candidates also struggled to show a complete profile, keep track of interviews and tasks, and understand payouts and withdrawals, which hurt confidence on both sides.
Scope Of Project
- Access & Home: Sign up / sign in, welcoming landing, and a clear dashboard for each role.
- Projects: Create and edit projects, revise dates, add team members, and see an organized list of projects.
- Talent & Evaluation: Search individuals or suppliers, open full profiles, and keep interview lists handy.
- Interviews: Friendly scheduling with a clear notice, start the call, and move to the next step confidently.
- Onboarding → Active Work: Guided onboarding after interviews; track an active project, see each resource, and review work.
- Money: Add funds, save a payment method, view balances, see payout status, add a bank account, withdraw, and view history.
- Collaboration & Notices: Inbox and Pod spaces for conversations, plus notifications in one place
The Solution
- We connected the whole journey end-to-end: clients create a project, shortlist people (individuals or suppliers), schedule interviews with a clear notice, start the call, and then onboard the chosen person right away.
- We created an Active Project hub that shows each resource and their work in one place, so clients can review and move forward without hunting through screens.
- We simplified money into one clear flow: Add Funds, see Project Balance, and Add Payment Method now work together like a single wallet for the project.
- We made payouts predictable: clients see payout status in Finances, while candidates can add/manage bank accounts and withdraw balance with a visible history.
- We strengthened candidate profiles with photo, skills, experience, and a short video—plus an easy way to ask for reviews and display them.
- We made interviews smoother for candidates: a clear list of upcoming calls, one-click join, a prep space for files/work, and a completed state after the call.
- We streamlined delivery: candidates log timesheets and tasks, and clients see those items alongside the active project for quick review and approval.
- We kept conversations tidy with Inbox (messages), Pod (project space), and a single Notifications area.
The Impact on Business
Technology USED
- Figma, Adobe XD for mockups, prototypes, and handoff
- Publishing and Content Management
The Challenge
Most books existed only as scanned PDFs, which meant readers couldn’t search within them or use assistive tools easily. Audio versions were missing or scattered, and people had to jump between different apps to read or listen. On the admin side, uploading a book, adding details, tracking transcription progress, and publishing updates took too many steps—with no simple way to review what’s live or fix mistakes quickly. Together, this slowed access for readers and created extra work for staff.
Scope Of Project
- Admins sign in and land on a clear home screen with a simple starting point
- Admins add book details and run a guided upload that creates clean text and audio versions
- Admins review the results and publish without switching tools
Readers discover books and save favourites in My Library - Each title opens to a focused book page with one click to read the text or listen to the audio
- The product covers the full journey from uploading a book to enjoying it in text or audio in one web app
The Solution
- End-to-end admin workflow: From Admin Sign Up/Sign In to Upload Book Details and a guided Upload/Process sequence that produces both text and audio, with clear screens for review and publishing.
- Reader-first experience: A simple Homepage for discovery, My Library to collect favourites, and a focused book view with two clear modes—Read (PDF-to-text) and Listen (audio)—so users can switch based on preference.
- Accessibility by default: Searchable text replaces image-only pages; audio transcripts open the catalogue to people who prefer listening or use assistive tech.
- Operational clarity: Admin homepage snapshots help staff see what’s in draft, in processing, or published, reducing back-and-forth and manual checks.
The Impact on Business
Technology used
- Figma, Adobe XD for mockups, prototypes, and handoff
- Broadcast & Communication
The Challenge
Scope Of Project
- Secure login for sales, managers, directors, and clients with role-specific home screens
- A complete sales journey that moves from suspect and prospect bases to approach, demo, and close with clear stage views and lists
- Time Order Form creation with schedule details, order lists, and conflict checks before submission
- Approvals for sales managers and directors, including quick accept or send back with remarks
- Targets, attendance, and remarks pages so reps and managers track progress without side files
- Budget planning plus performance dashboards for annual, monthly, and by-channel views
- A single client view with history, active orders, schedules, and post-campaign reviews
- Client dashboard with radio analytics so customers see results without asking for exports
The Solution
- A unified web portal that starts at login and guides each role to the next best action, from creating a lead to submitting a Time Order Form and getting it approved
- A structured pipeline that turns suspect and prospect lists into a live funnel with stage pages for approach, demo, close, and an end-of-process report
- Time Order Forms tied to the schedule, with validations that catch clashes and incomplete details before managers see the request
- A two-level approval flow for managers and directors, including quick status changes and recorded remarks for audit and coaching
- Performance views that roll up annual, monthly, and channel numbers, alongside budget planning and sales targets on one screen
- An attendance and remarks tracker so daily activity and outcomes are visible without side spreadsheets
- A client dashboard that presents radio analytics in a simple report format, reducing back-and-forth and building trust after each campaign
The Impact on Business
Technology used
- Figma, Adobe XD for mockups, prototypes, and handoff
- Humanitarian Aid
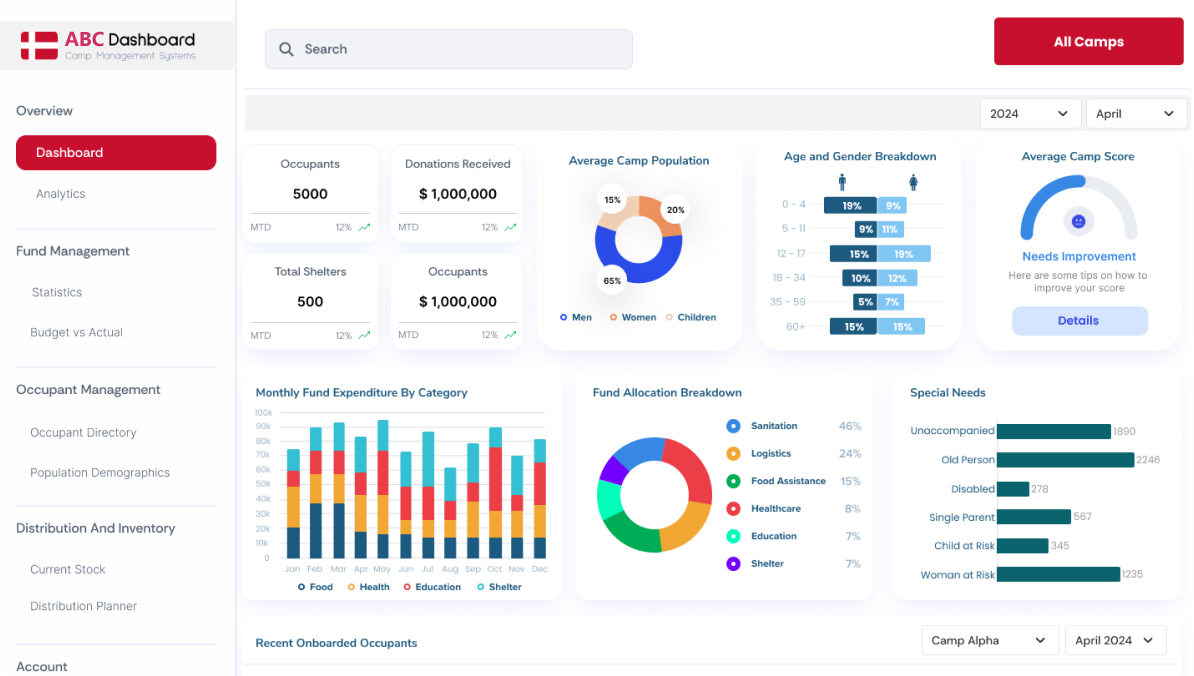
The Challenge
Scope Of Project
- A secure sign-in and sign-up flow for authorized staff
- A guided registration that captures a new occupant’s details from the first conversation
- An occupant directory that is easy to search and browse during field work
- A dashboard overview that shows the current picture of the camp at a glance
- An “add new occupant” path designed for speed at registration desks and mobile tents
The Solution
- A unified web portal with staff login and a simple start point for daily tasks
- A step-by-step register screen that reduces re-entry and helps capture clean household data
- A searchable occupant directory with quick filters so case workers can find people fast
- A dashboard overview that surfaces key counts and recent changes to support decisions on the ground
- A fast “add new occupant” action for intake teams during peak arrivals and relocations
The Impact on Business
Technology USED
- Figma, Adobe XD for mockups, prototypes, and handoff
- Data Centre


The Challenge
The large MSP recognised the critical need for superior service delivery across its Data Centre environments. The organisation is a growing business using the infrastructure within the multi-site Data Centres to power websites, phone systems, software, AI and more for its customers. The need for quality of services with the appropriate software support and parts to site support model was paramount.
The primary challenges faced by the organisation included the need to manage costs and improve operational management of its large changing estate with in excess of 2,300 networking devices which included routers, UPS’s, switches and access points.
Scope Of Project
- Hardware & Software Support
Covers multi-vendor networking equipment (e.g. routers, switches, firewalls) and associated software platforms. Includes diagnostics, repair, and replacement of faulty components. - Break-Fix Maintenance Model
Reactive support for unexpected failures, ensuring minimal disruption to operations. Services include:- Fault identification and triage
- On-site or remote resolution
- Equipment replacement and configuration
- Service Level Agreements (SLAs)
- 4-Hour Response SLA: For mission-critical incidents, a qualified engineer or replacement unit is dispatched within four hours of issue reporting.
- Next Business Day (NBD) SLA: For non-critical issues, resolution or equipment delivery is guaranteed by the next business day.
The Solution
We are providing a networking hardware & software break fix maintenance contract with for our partner’s high-security customer estate, spanning seven sites across the India. Services were facilitating the timely response & delivery of equipment under 4 hour and next business day response times.
We setup an internal transition team to engage with various business units and the partner, ensuring compliance with all regulations. We coordinated with the partner to deploy highly skilled engineers for access to Data Centre sites. Our team conducted due diligence and provided recommendation reports. Additionally, we supplied extra project resources for configuration and installation services and delivered comprehensive customer reports on break-fix and ad-hoc calls.
Technologies Infrastructure
- Servers Racks : Data center server racks are essential for organizing and managing IT equipment. They come in various types,
- Storage Devices : Data center storage devices include various types of hardware such as HDDs, SSDs, and tape drives, organized in systems like DAS, NAS, and SAN to efficiently manage and distribute data.
- Networking Equipment : Modems, routers, cables, and switches.
- power distribution units (PDUs) : Takes power from a main supply and distributes it to equipment like servers, routers, and switches.
- cooling systems : “Air cooling” This cooling method is ideal for smaller or older data centers, “Liquid cooling” A relatively newer technology is liquid cooling. It’s a more efficient and cost-effective cooling
- Security measures : Encryption algorithms, firewalls, and IDS/IPS.
- It also includes components like racks, cabinets, and fire suppression systems.
- Preventing a Ransomware Attack for a Financial Client

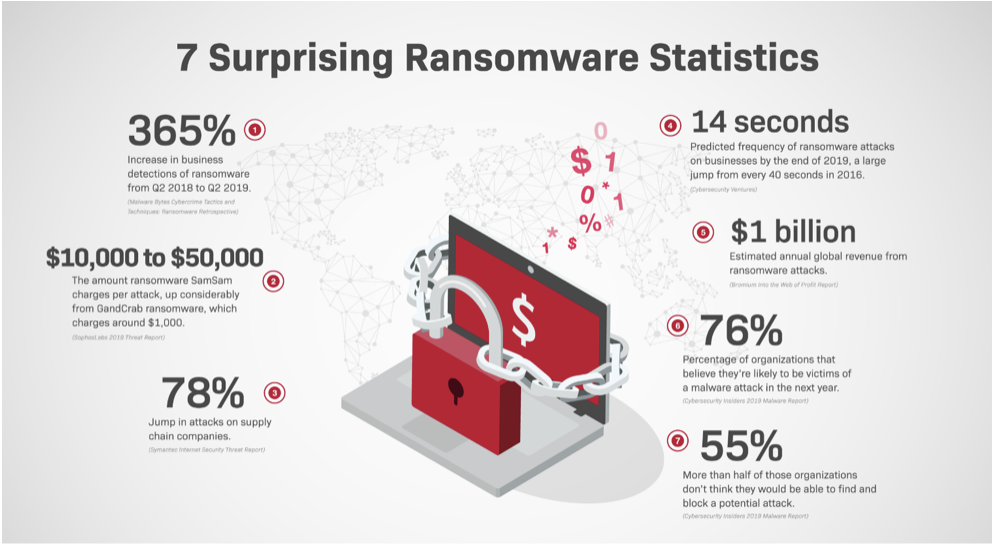


Client Profile
A mid-sized financial services company with 500+ employees operating across multiple branch offices and remote locations. Their business relied heavily on online banking applications, customer data management platforms, and third-party financial APIs.
The Challenge
The client began noticing phishing emails disguised as banking alerts being delivered to staff. Some employees unintentionally clicked links, exposing the company to credential theft and ransomware risk.
- Their legacy email security solution had limited filtering capability.
- No multi-factor authentication (MFA) was enforced, so compromised credentials posed a severe risk.
- IT staff lacked visibility into network activity, increasing the chances of delayed response to cyber incidents.
The Solution
- Conducted a comprehensive cybersecurity audit and phishing simulation test for employees.
- Implemented an AI-powered email security gateway to block malicious attachments and spoofed domains.
- Enforced multi-factor authentication (MFA) across all critical applications.
- Delivered cyber awareness workshops tailored to financial services staff (how to spot phishing, handling suspicious emails).
- Deployed a 24/7 Security Information and Event Management (SIEM) solution to detect abnormal login activity and attempted ransomware payloads.
Result
- 98% of phishing attempts were blocked before reaching end users.· Phishing awareness training resulted in a 70% reduction in employees clicking malicious links.
- Achieved a 65% reduction in overall cyber risk exposure within 3 months.
- No ransomware or data breaches occurred during and after the engagement.
- The company achieved smoother compliance with PCI DSS and ISO 27001 standards and passed their regulatory IT audit with zero observations
- Securing Healthcare Data & Ensuring HIPAA Compliance
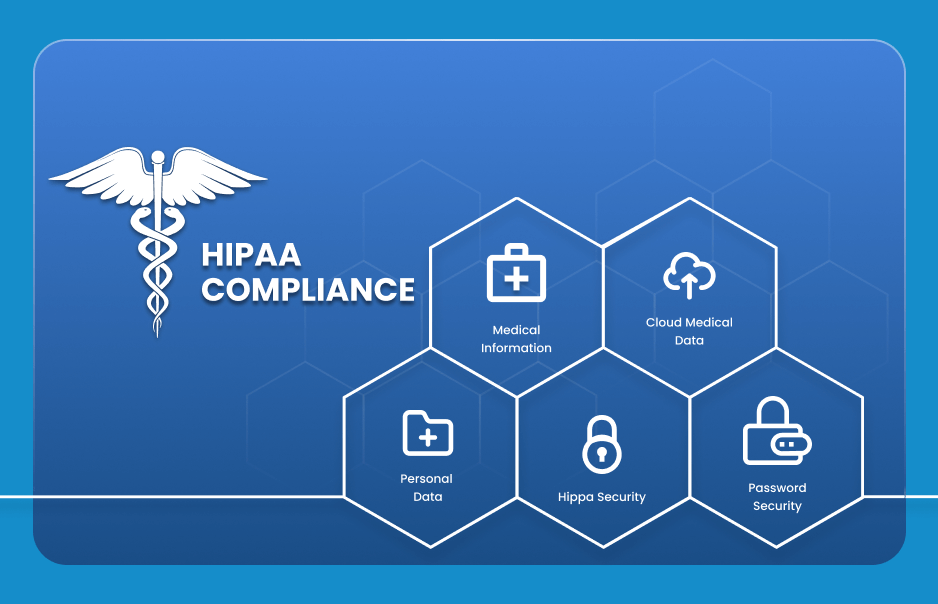


Client Profile
A healthcare IT provider responsible for managing electronic health records (EHR) for over 50,000 patients across multiple hospitals and clinics. Their infrastructure included a hybrid environment with both on-premise and cloud data storage.
The Challenge
The client faced urgent challenges around patient data security and compliance risks:
- Access control gaps allowed staff members outside clinical teams to access sensitive health records.
- Patient records were stored unencrypted, leaving them vulnerable to data theft.
- The organization lacked a disaster recovery (DR) plan, making them unprepared for a cyberattack or ransomware incident.
- They were at risk of failing a HIPAA compliance audit, which could result in heavy fines and loss of credibility.
Solution Delivered
- Implemented end-to-end encryption for all patient health records, both in storage and during transmission.
- Designed and enforced role-based access controls (RBAC), ensuring only authorized medical professionals could access specific patient data.
- Built a disaster recovery and business continuity plan, including automated secure backups with a 15-minute Recovery Point Objective (RPO).
- Deployed cloud security monitoring and intrusion detection systems (IDS) for continuous protection.
- Conducted HIPAA compliance workshops with IT and hospital management staff.
Business Impact : Result
- Achieved 100% HIPAA compliance within 6 months, passing a third-party audit without violations.
- Reduced insider data access violations by 80%, thanks to RBAC policies.
- The new disaster recovery plan ensured minimal downtime, giving the client confidence in resilience against ransomware.
- Partner hospitals reported greater trust and satisfaction, leading to new business contracts for the healthcare IT provider.
All the reasons to choose BIITS.
B-Informative IT Services Pvt. Ltd. (BIITS) is an award-winning Business Intelligence & Digital & Consulting company based out of Indian Silicon Valley, Bangalore. We are a team of motivated professionals with expertise in different domains and industries. We help our clients to derive simplified and conclusive data insights for effective decision making.