- Dashboard-realtime insights
Industry
Challanges
Scope of the Project
- Migrating reporting from Excel to Tableau using the Infinity data source.
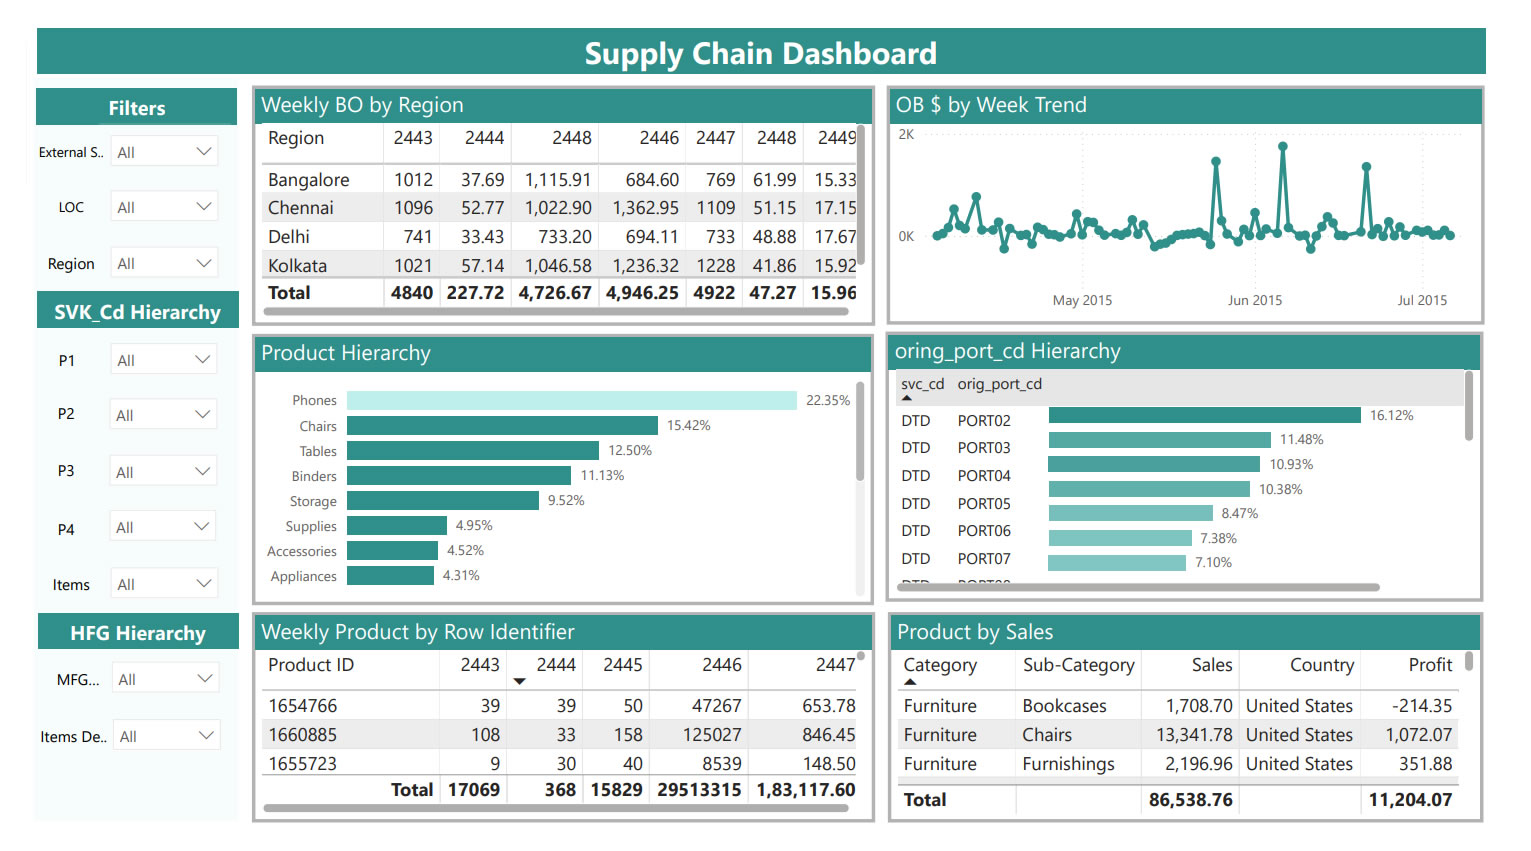
- Building a Master Production Schedule (MPS) Dashboard to monitor inventory and supply chain metrics.
- Offering historical, summary, and Weeks of Supply (WOS) views at multiple hierarchy levels (item, location, and region).
- Ensuring data integrity and real-time updates to improve decision-making.
Solution Provided
- Data Preparation and Processing:
Raw data from multiple systems was integrated through the Infinity platform and processed using Alteryx. Existing macros were enhanced with new formulas to clean, transform, and standardize the data at item, location, and region levels. This created a reliable foundation for accurate reporting. - Master Production Schedule (MPS) Output:
The processed data was used to generate a detailed MPS output, which included metrics such as Weeks of Supply (WOS), backorders, calculated on-hand inventory, deploy-in/out movements, plan orders, and safety stock levels. - Interactive Tableau Dashboards:
The MPS output was visualized in Tableau, with dashboards designed to provide historical views, summary reports, and WOS analysis. Drill-down capabilities allowed users to analyze performance at granular levels, such as by warehouse, product line, or region. - Automation and Real-Time Insights:
Automated workflows in Alteryx and Tableau ensured weekly updates with minimal manual intervention. This provided near real-time visibility into stock levels, demand, and supply chain risks. - Actionable Analytics:
The dashboards enabled supply chain teams to quickly identify inefficiencies, manage stock movements, and balance inventory across locations. Early warnings for potential stockouts or overstock situations allowed timely corrective actions.
Business Impact
- Improved Efficiency: Automated updates significantly reduced manual effort, freeing teams to focus on strategic planning rather than data preparation.
- Real-Time Visibility: Managers could monitor inventory, backorders, and WOS across all locations with up-to-date insights.
- Risk Reduction: Proactive identification of supply-demand imbalances minimized the risk of stockouts and excess inventory.
- Faster Decision-Making: Interactive dashboards and drill-down analysis enabled leaders to act quickly and confidently.
- Scalability: The solution established a foundation that could easily adapt to growing data volumes and additional KPIs.
Technical Architecture
- Data source: Infinity (inventory and supply chain systems).
- Data Processing & ETL: Alteryx (data cleaning, transformation, aggregation, macros, and formula enhancements)
- Visualization & Reporting: Tableau (MPS dashboards, historical views, summary views, WOS analysis)
- Automation: Scheduled workflows and automated data refreshes in Alteryx and Tableau
- Shipment Tracking
Challanges
Key challenges included:
- Stockouts of fast-moving products, resulting in missed sales opportunities.
- Overstocking of slow-moving items, leading to high storage costs and waste.
- Supplier delays and logistics bottlenecks, which increased shipping costs and eroded customer satisfaction.
- High defect rates, damaging brand reputation.
- Fragmented and manual processes, with reliance on Tableau server exports, Excel mapping, and pivot table analysis—limiting the ability to scale, automate, and provide timely insights.
- Poor demand forecasting caused by inconsistent data, delaying critical business decisions.
Scope of Project
- Consolidating shipment data from multiple sources into a single, automated reporting system.
- Providing visibility into order fulfillment, supplier performance, delivery timelines, and product movement.
- Implementing automated alerts for stockouts and overstock conditions.
- Empowering decision-makers with real-time, drill-down insights into product sales trends, partner performance, and logistics efficiency.
Solution Provided
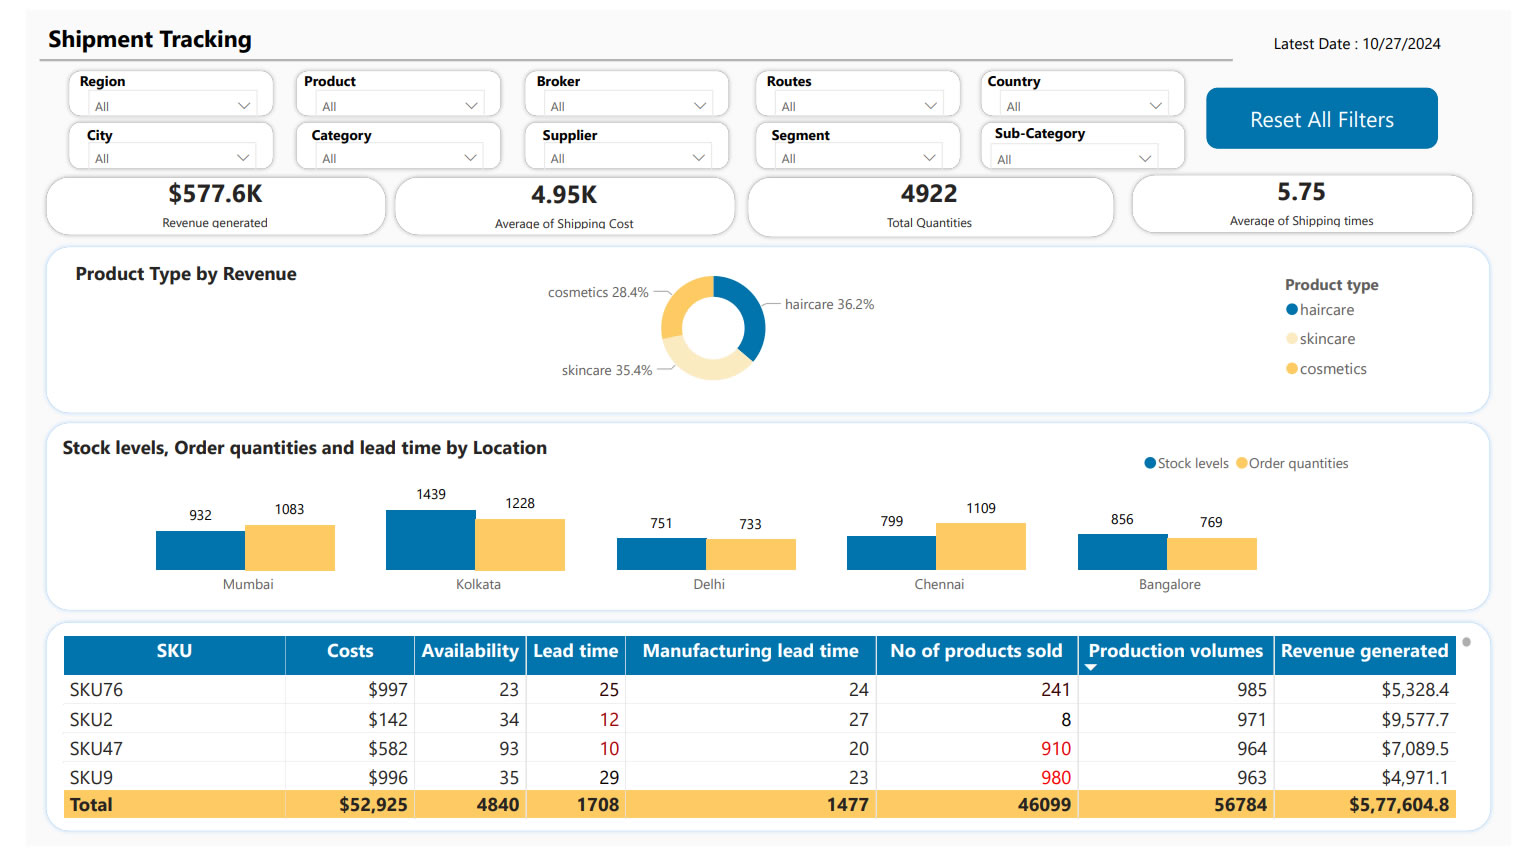
A comprehensive Shipment Tracking Dashboard was developed in Power BI, supported by an automated ETL and data integration pipeline.
- Data Integration & Automation
Data was ingested from multiple sources, including Nielsen, SharePoint, and Excel files. Alteryx and Python scripts were used to automate extraction, transformation, and loading (ETL) processes. A dedicated database (Snowflake) was created to store cleaned and structured shipment data, removing dependency on manual Excel exports. - Data Preparation & Transformation
Using Alteryx workflows, the manual Excel and pivot-table-based process was eliminated. Data was cleansed, standardized, and mapped to common dimensions (product hierarchy, suppliers, time, and regions). DAX modeling in Power BI enabled creation of calculated metrics for shipment value, lead times, and stock movement. - Power BI Dashboard Development
The dashboard provided stakeholders with:- A time-period comparison of total shipment value.
- Drill-down capabilities to analyze performance at product, sub-brand, or supplier level.
- Insights into shipment delays, supplier performance, and defect rates.
- Automated alerts and KPIs for stockouts, overstock risks, and fulfillment gaps.
- Real-Time Monitoring & Alerts
The dashboards refreshed automatically on a daily/weekly basis, giving near real-time visibility. Notifications highlighted underperforming suppliers, late deliveries, and shipment anomalies, enabling proactive decision-making. - Scalable Architecture
The solution was designed for scalability with additional geographies, suppliers, and KPIs. SharePoint was integrated to host files that change based on availability, ensuring seamless updates without manual intervention.
This end-to-end automation transformed shipment analysis from a reactive, Excel-based process into a proactive, real-time system.
Business Impact
- Reduced Manual Effort: Automation removed dependency on manual Excel mapping and pivot tables, cutting reporting time significantly.
- Improved Visibility: Stakeholders gained access to a unified view of shipments across suppliers, regions, and product lines.
- Operational Efficiency: Early detection of stockouts, overstock, and supplier delays improved inventory balance and reduced costs.
- Faster Decision-Making: Interactive dashboards enabled managers to drill down to granular details and respond quickly.
- Enhanced Customer Satisfaction: Timely shipments and fewer disruptions improved service reliability and brand trust.
- Scalable Insights: The architecture allowed easy expansion to more datasets, ensuring long-term sustainability.
Technology Stack
- Data Sources: Nielsen, SharePoint, Excel, Supplier Data
- ETL & Data Processing: Alteryx, Python, Snowflake
- Visualization & Analytics: Power BI Desktop & Power BI Services (DAX modeling, interactive dashboards, automated alerts)
- Collaboration & Automation: SharePoint for file hosting, Power BI Services for secure sharing and role-based access
- Supply Chain Analytics
Challanges
Scope of Project
Scope of Project
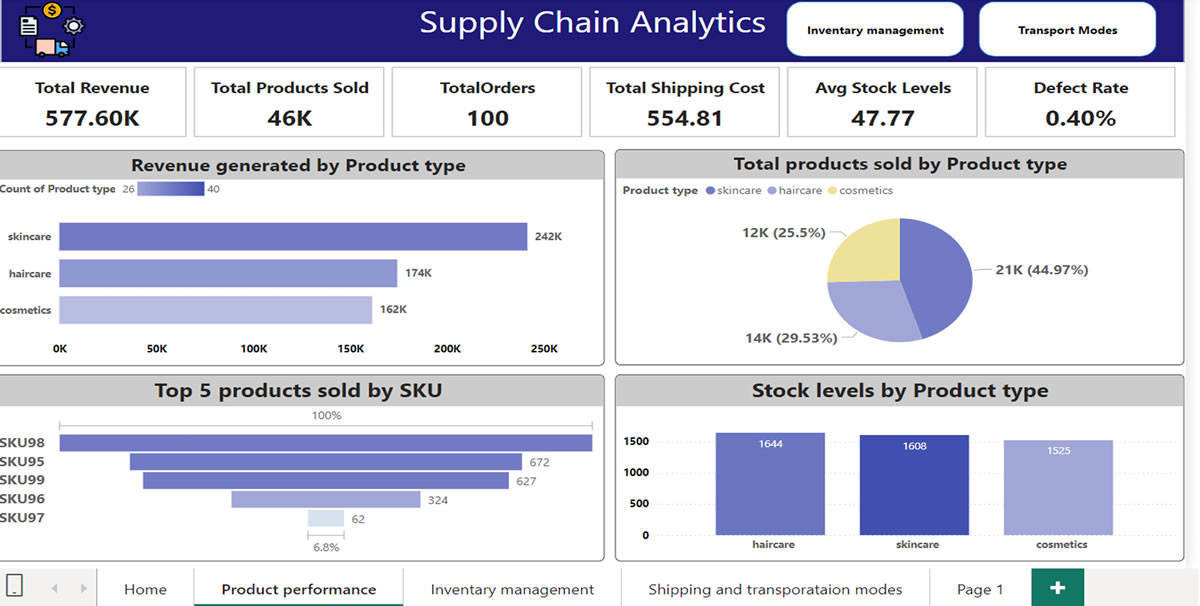
- Inventory Optimization: Automated alerts were implemented for both low stock levels and excess inventory, ensuring timely replenishment and avoiding unnecessary overstocking.
- Supplier Performance Management: Dashboards tracked supplier lead times and order fulfillment rates, enabling the identification of reliable partners and quick action against underperforming suppliers.
- Logistics & Shipping Efficiency: Analytics were used to monitor shipping costs and optimize delivery routes. Real-time tracking of delivery times helped reduce delays and improve on-time fulfillment.
- Quality Control Monitoring: Dashboards monitored defect rates and inspection results, allowing the business to identify recurring issues and reduce returns.
- Predictive Insights: Sales trends and demand forecasting models provided better planning capability, helping to align production with actual consumer demand.
Business Impact
- Reduced Stockouts and Excess Inventory, improving product availability while lowering carrying costs.
- Improved Supplier Relationships through data-backed performance evaluations and stronger delivery reliability.
- Optimized Logistics Costs by reducing shipping inefficiencies and minimizing delays.
- Enhanced Product Quality with better defect tracking, leading to fewer returns and stronger brand reputation.
- Greater Customer Satisfaction driven by reliable product availability and faster, more efficient delivery.
Technology stack
- Data Integration & Preparation: SQL, Excel
- Visualization & Dashboards: Power BI / Tableau
- Data Analytics & Forecasting: Statistical models for demand forecasting and supplier performance analysis
- Automation: Alerts and notifications for inventory and supplier KPIs
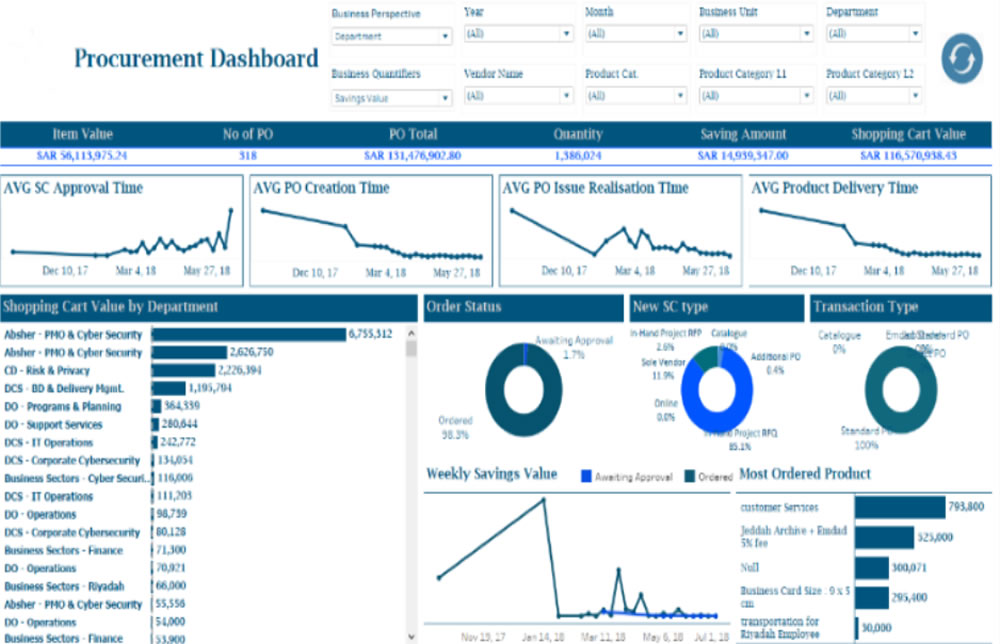
- Supply Chain -Procurement
The Challenge
- Lack of unified reporting and performance visibility across procurement operations.
- Manual preparation of reports caused delays in delivering actionable insights to senior management.
- Difficulty in consolidating and validating data across departments to ensure consistency.
- Limited visualization tools and lack of interactivity in reports.
Executive Summary
Scope of Project
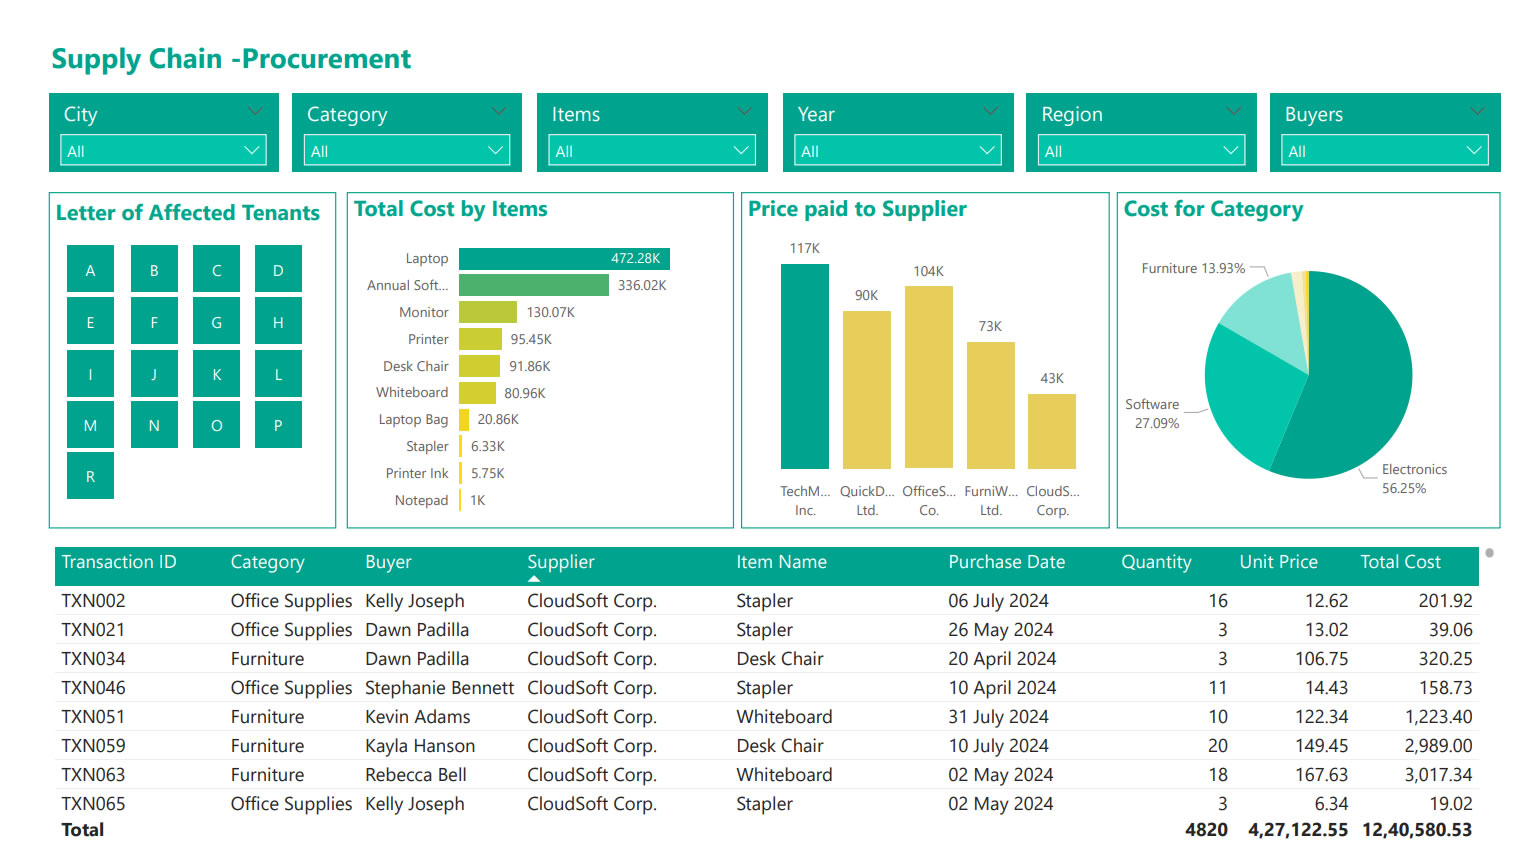
- Track procurement process efficiency and performance metrics.
- Automate the generation of daily, weekly, monthly, and quarterly reports.
- Enable senior management to make informed business decisions through interactive dashboards.
Solution
-
Data Analysis & Visualization
-
Used Tableau to design multiple visualization types:
- Dual Axis Charts, Combo Charts, Pie & Bar Charts, Geographic & Heat Maps, Small Multiples.
- Implemented drill-through reports, hierarchies, and quick filters to enhance interactivity.
- Created calculated fields, parameters, and custom labels for precision in reporting.
-
Used Tableau to design multiple visualization types:
-
Data Integration & Automation
- Blended Excel-based data sources with Tableau for real-time updates.
- Designed and validated Tableau business scenarios to ensure accurate reporting.
- Published data
- extracts and dashboards to Power BI Online Services, enabling cloud access.
- Scheduled automated data refreshes on a daily, weekly, and monthly basis.
- MIS Reporting & Management Insights
- Developed interactive dashboards for procurement and client service metrics.
- Created clear and concise reporting formats for senior management reviews.
- Conducted weekly meetings to align data interpretation across departments.
Business Impact
Impact Area | Results Achieved |
Operational Efficiency | Reduced report preparation time by 60% through automation and pre-scheduled data extracts. |
Decision-Making | Delivered actionable insights with interactive dashboards, enabling faster procurement decisions. |
Data Accuracy | Improved consistency and trust in reporting with validated data and automated refreshes. |
Process Optimization | Visual procurement trend analysis led to process improvements and better vendor negotiations. |
Executive Visibility | Senior management gained real-time access to procurement performance metrics, enhancing strategic planning. |
Collaboration | Weekly data review meetings created a standardized approach to procurement analytics across teams. |
Technology Environment
- Visualization: Tableau
- Data Source: Excel
- Publishing & Scheduling: Power BI Online Services
- “SuperStore Dashboard” for Retail Analytics

Industry :
The Challenge
- Fragmented sales data: Sales, product, customer, and regional data were spread across several systems (POS, inventory, CRM), making integrated analysis difficult.
- Slow report turnaround: Business users had to wait for periodic static reports to understand performance; real-time or near-real-time insights were lacking.
- Lack of product & regional visibility: Hard to spot which products are under-performing, which regions or stores are lagging, or how sales are trending over time.
- Difficulty in monitoring profitability: Margins, discount impacts, cost of goods sold, and returns were not visible in the same view, making profitability analysis cumbersome.
- Limited interactivity: Reports were largely static; users could not drill down, filter dynamically, or compare scenarios effectively.
Scope of Project
- Bring together data from multiple sources (sales, inventory, customers, returns, channels) into one unified view.
- Provide real-time or near real-time insights into sales trends, product performance by category, regional/store comparisons, customer segments, and profit margins.
- Offer interactive features including filtering, drill downs (e.g., by product, region, time), top/bottom product lists, trend lines.
- Enable business users (store managers, merchandisers, senior management) to monitor KPIs such as sales growth, average order value, discount performance, returns rate, inventory turnover.
- Provide visual tools to analyze promotions, seasonal effects, product category performance, channel contributions etc.
Solution Provided
- Designed and built a Tableau Dashboard (“SuperStore Dashboard”) combining multiple views:
- Sales over Time: Trend lines and month-by-month comparisons.
- Region/Store Performance: Maps or bar charts comparing performance across geography.
- Product & Category Analysis: Top selling products, margin by category, discount impact.
- Customer Segmentation: Repeat vs new customers, average purchase size.
- Returns & Profitability: Return rates and margin erosion by discount or product type.
- Data integration setup:
- Combined data from POS, inventory, return systems, CRM.
- Data cleaning & transformation to standardize product/category naming, handle missing values etc.
- Dashboard interactivity:
- Filters (region, product category, time period).
- Drill down features (e.g. store → city → region).
- Parameter controls for user-selected scenarios (e.g. comparing periods, applying discount thresholds).
- Performance optimization:
- Some pre-aggregated tables / extracts for faster loading.
- Using incremental refreshes where possible.
- Deployment & sharing:
- Published dashboards to Tableau Server / Tableau Public for widest access.
- Role-based access: store managers vs regional managers vs senior executives.
Business Impect
| Area | Results / Improvements |
| Speed of Insights | Reports that used to take days to generate are now available in real time or near-real time, enabling faster decision-making. |
| Product & Regional Visibility | Under-performing products and regions are identified sooner; corrective actions (promotions, stock reallocation) implemented faster. |
| Profitability Awareness | Better visibility into discounts, returns, and cost structure improved margin management. |
| Enhanced Sales Performance | Increased sales growth through better alignment of inventory with demand, promotion effectiveness, and identifying high potential products. |
| Operational Efficiency | Reduced manual effort in reporting; fewer ad-hoc requests for data; dashboard reuse lowered load on data teams. |
| User Engagement & Decision Support | Business users (store/regional/senior management) adopted dashboard as a “single source of truth”; used daily to inform strategy. |
Tools & Technology Environment
- Visualization & BI Tool: Tableau Desktop, Tableau Server / Tableau Public
- Data Sources: POS (point of sale) systems, inventory management systems, CRM, returns data, product master data
- Data Preparation / ETL: Data cleaning, transformation (product names, categories, returns data), standardizing time periods etc. Possibly SQL / database extracts or data warehouses
- Performance Optimizations: Data extracts / aggregations, incremental refresh, optimized filters and parameter use
- User Access / Security: Role-based permissions, sharing via dashboards (server / public or private), filters at user level
- Retail Procurement Analytics Transformation
Industry :
The Challenge
- Providing senior management with monthly, quarterly, and half-yearly performance reports in a clear and consistent format.
- Ensuring data consistency across departments by sharing validated insights weekly.
- Extracting and preparing procurement data from ServiceNow web services, which required complex parsing and transformation before being usable.
- Managing data in formats unsuitable for direct visualization, requiring advanced data modeling and cleansing.
- Understanding domain-specific procurement metrics in order to create meaningful dashboards and KPIs.
- Consolidate and analyse data across locations and product lines.
- Implement secure, role-based access to sensitive data.
- Improve reporting performance and reduce manual effort.
Solution
A comprehensive data preparation and visualization framework was implemented, integrating Alteryx for data processing and Tableau/Power BI for reporting. The approach included:
- Data Extraction & Transformation
- Used Alteryx to connect with ServiceNow, parse unstructured data, and perform RegEx-based pattern matching.
- Modeled and transformed data into Tableau-compatible .TDE files for efficient use.
- Interactive Dashboards & Reports
- Designed dual-axis charts, combo charts, heat maps, geographic maps, small multiples, and drill-through reports to provide multi-dimensional insights.
- Developed calculated fields and parameters for custom KPIs aligned with procurement goals.
- Built interactive dashboards tailored to management requirements.
- Performance & MIS Reporting
- Automated generation of daily, weekly, and monthly procurement reports.
- Created MIS and performance dashboards for procurement and client service teams.
- Designed standardized reporting formats for consistent communication across departments.
- Publishing & Scheduling
- Published dashboards and data sources to Power BI Online Services.
- Scheduled refreshes (daily/weekly/monthly) to ensure real-time accuracy.
Business Impect
- Improved Procurement Efficiency: Senior management gained clear visibility into procurement KPIs, enabling faster and more accurate decision-making.
- Time Savings in Data Preparation: Automated data extraction and transformation with Alteryx reduced manual effort by over 40%.
- Faster Insights: Interactive dashboards allowed executives to drill down into procurement details instantly, cutting analysis turnaround times from weeks to hours.
- Consistency Across the Organization: Weekly reviews ensured that all departments had access to standardized, reliable data for planning and execution.
- Scalable Reporting Framework: The solution enabled easy addition of new data sources, KPIs, and visualization requirements without disrupting existing workflows.
Tools & Technology Environment
- Data Preparation: Alteryx (Parsing, RegEx, Data Extraction)
- Visualization: Tableau, Power BI
- Data Sources: Service Now Web Services
- Tableau Integration for a Leading Retail & Manufacturing Steel Supplier
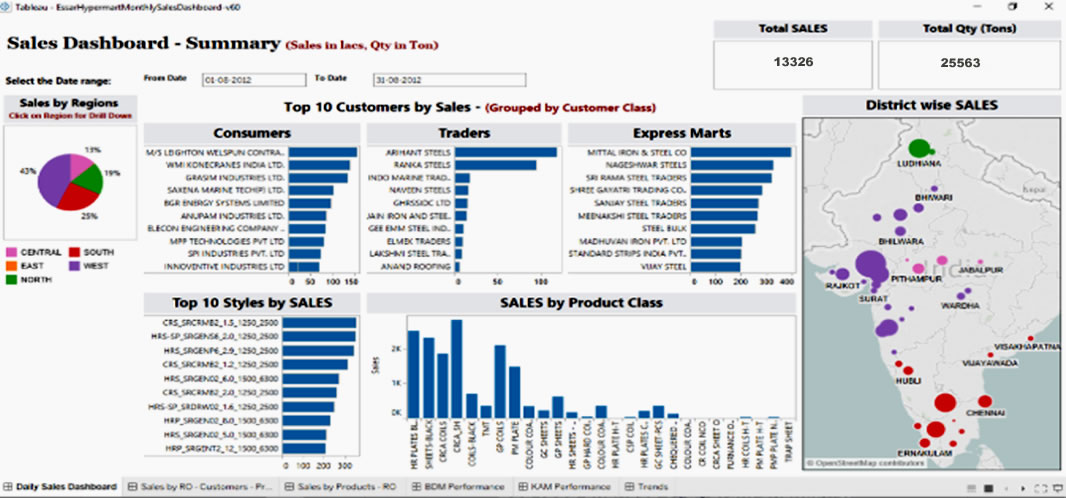
Industry :
The Backgroud
A leading retail and manufacturing steel supplier offers a wide range of steel products catering to multiple industry segments. With a robust distribution network and value-added services such as channel financing, doorstep delivery, and customised steel processing, the company serves both small and bulk buyers across Asia and North America.
The Challenge
The company generated large volumes of sales and operational data on a daily, weekly, and monthly basis, segmented by product type and location. The existing reporting process was fragmented, making it difficult for business teams to quickly analyse data, monitor performance, and make informed decisions. The company needed a powerful analytics platform integrated with its existing system to:
- Consolidate and analyse data across locations and product lines.
- Implement secure, role-based access to sensitive data.
- Improve reporting performance and reduce manual effort.
Scope of Project
- Tableau integration and configuration with the current platform.
- Development and testing of interactive dashboards.
- Matching Tableau Server authentication with the current platform.
- OLAP cube design, validation, and performance optimisation.
- Post-implementation support and maintenance.
Solution Delivered
The project involved the complete lifecycle implementation of Tableau analytics, ensuring seamless integration with the client’s existing systems. Key activities included:
- Custom Authentication & Security: Implemented Tableau Server authentication aligned with the current platform, along with cube-level and report-level security to safeguard sensitive information.
- Cube Design Validation: Verified all measures, dimensions, hierarchies, and calculated metrics for accuracy.
- Security Validation: Mapped cube roles to user groups and ensured correct access privileges.
- Performance Optimisation: Enhanced data processing speed and query performance for faster dashboard load times.
- Post-Implementation Support: Provided ongoing technical and user support for smooth adoption.
Business Impect
- 60% Reduction in Report Generation Time: Automated dashboards replaced manual reporting, enabling near real-time data access.
- Improved Decision-Making: Management could now access role-specific, accurate insights in minutes instead of hours.
- Enhanced Data Security: Role-based authentication ensured that sensitive sales and operational data was only visible to authorised users.
- Increased Operational Efficiency: Faster performance and automated analytics allowed business teams to focus more on strategy rather than data preparation.
- Scalability for Growth: The integrated Tableau platform could now easily handle growing data volumes and new reporting requirements.
Tools & Technology Environment
- Data Preparation: Alteryx (Parsing, RegEx, Data Extraction)
- Visualization: Tableau, Power BI
- Data Sources: Service Now Web Services
- Sales
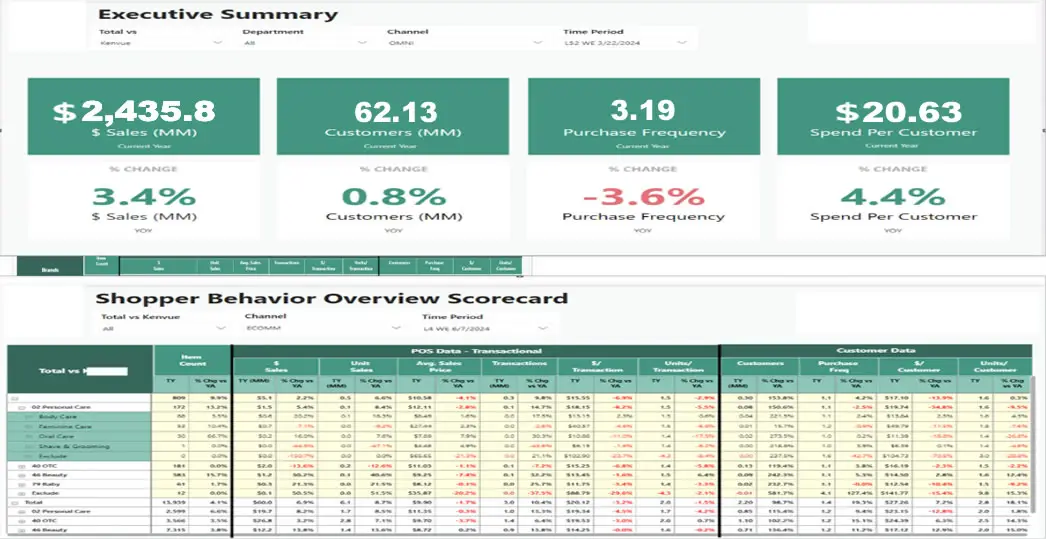
The Challenge
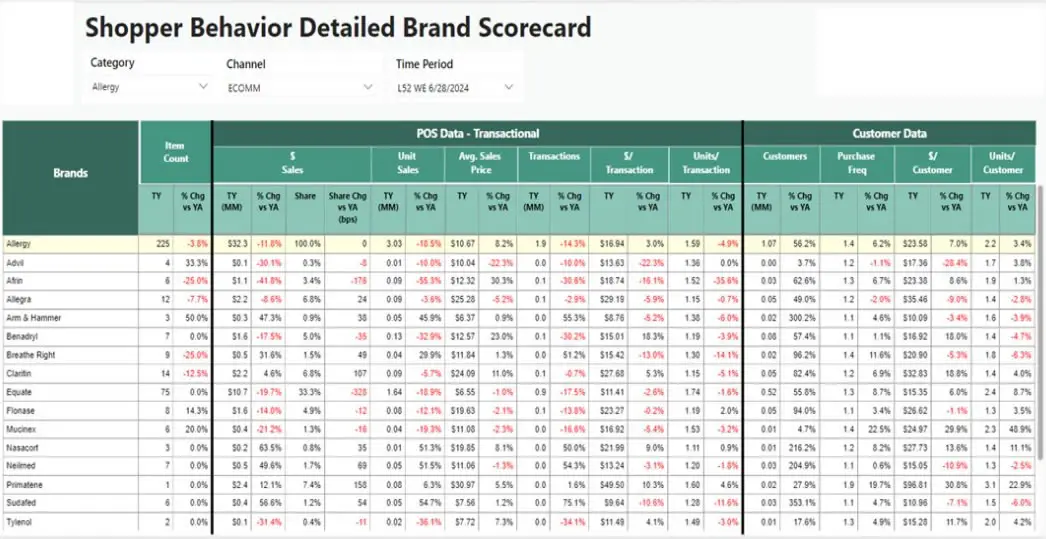
- Our Client Shopper Insights Project in which we built multiple Power BI Reports which provides in-depth transactional and customer data, offering insights into brand-level performance across multiple filters such as categories, channels, and time periods.
- Provides total market vs. brand performance at various levels, providing insights into transactional and customer purchase frequency.
- These reports comprise of aggregated metrics including sales, customer count, purchase frequency, and spend per customer, alongside their respective percentage changes.
- Using all the data which we downloaded from Luminate portal total 700 excels reports consists of multiple categorical data with different Segmentations and Time Periods to show the insights in the form of Power BI reports.
Scope of Project
- Automating & replicating manual approach of extracting Excel Reports, transforming them and refreshing Power BI Dashboards on a weekly cadence.
- A tool that leverages transactional and customer data to provide insights on the brand performance across channels and time periods.
Solution Delivered
- Built an automated streamlined process.
- Developed a data-optimized model to create a single source and increase performance.
- Built a Power BI dashboard based on provided UI design.
- Quality Process Optimization: Enhanced operational workflows and maintained consistent quality. ensured compliance with industry standards through rigorous quality control.
- Workload Reduction: Streamlined procedures and automated systems to reduce workload. achieved significant cost savings by minimizing rework and waste.
- Eliminated Human-Prone Errors: Implemented robust checks and automation to eliminate errors. increased accuracy and reliability, improving overall performance.
Business Impect
- Developed multiple Power BI reports to provide in-depth insights into transactional and customer data.
- Analyzed brand-level performance across categories, sales channels, and time periods.
- Reports offer comparative views of total market vs. brand performance, highlighting customer purchase behaviors.
- Key metrics include sales, customer count, purchase frequency, and spend per customer, with percentage changes.
- Sourced data from 700 Excel reports downloaded from the Luminate portal, containing segmented and time-based data.
- Enabled stakeholders to make data-driven decisions on brand strategies and market positioning.
- Provided clear, actionable insights into customer trends, helping to optimize resource allocation and enhance performance tracking.
Technology Stack
- Alteryx, Python, Selenium
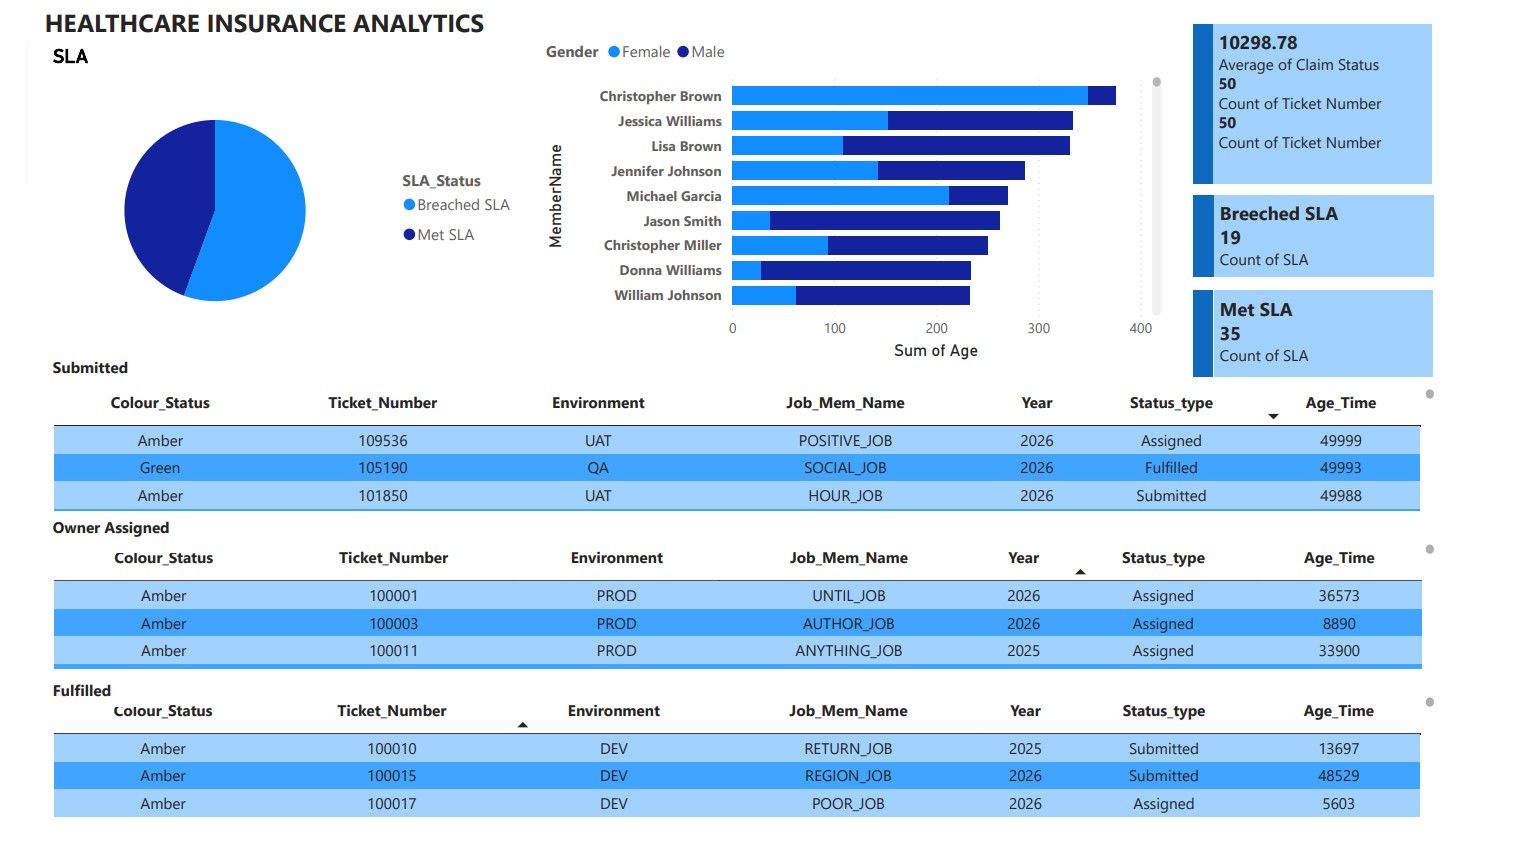
- Healthcare Insurance Analytics
Industry
The Challenge
- Developing interactive dashboards in Power BI / Power View.
- Integrating dashboards into a SharePoint portal for centralized access.
- Enabling scheduled report refreshes at defined intervals.
- Providing business users with role-specific reporting and secure authentication.
- Tracking and analyzing ticket resolution times, success rates, and failure trends for service request management.
Solution
- Power BI Integration with SharePoint
- Architected and developed dashboards in Power BI / Power View, embedding them into SharePoint via web parts.
- Configured different authentication levels to ensure user-specific access.
- Operational & Service Request Analytics
- Designed dashboards to track ticket submissions, pending items, closed requests, and resolution timeframes.
- Implemented success vs. failure rate tracking for service tickets.
- Automated Refresh & Scheduling
- Enabled scheduled report refreshes to ensure up-to-date data availability.
-
Ad-Hoc & Role-Based Reporting
- Created business-user-specific dashboards tailored to operational needs.
- Provided ad-hoc reporting capabilities for deeper analysis.
Business Impact
- Improved Operational Efficiency: Real-time visibility into ticket resolution times helped reduce average closure time by 30%.
- Centralized Access to Insights: SharePoint integration provided a single, secure portal for all reporting needs, reducing time spent searching for information.
- Enhanced Decision-Making: Role-based dashboards empowered managers and operational teams to address service issues proactively.
- Increased Data Accuracy: Automated refresh schedules ensured that all dashboards were updated with the latest available data.
- Scalability for Future Growth: The solution allowed easy addition of new reports and dashboards without major redevelopment.
Technical Architecture
- BI & Visualization: Power BI, Power View
- Collaboration: SharePoint
- Database: SQL Server 2008
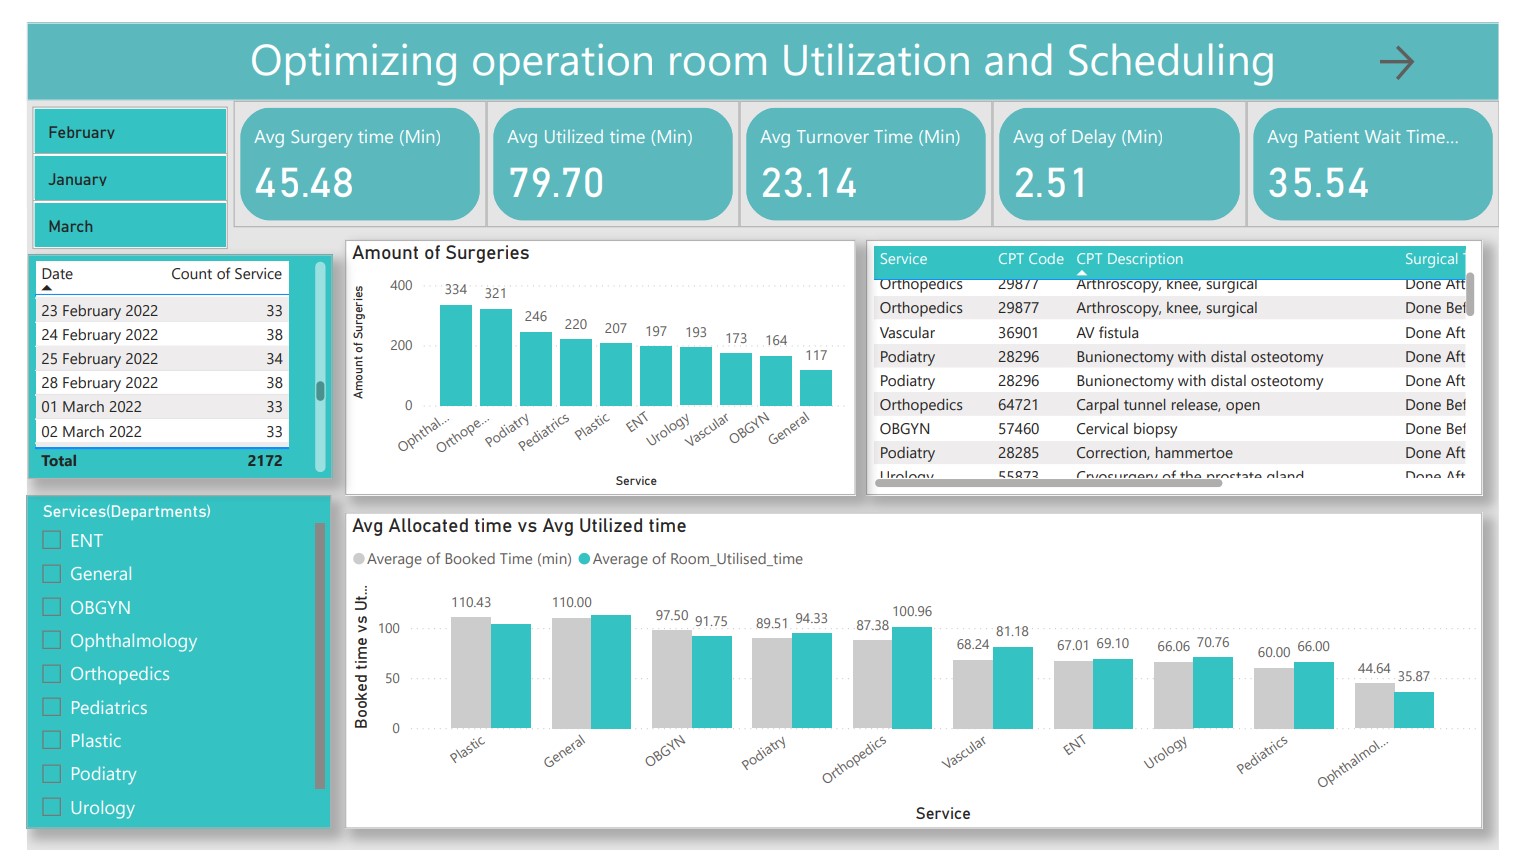
- HealthCare operating room (OR) utilization
Industry
Healthcare
The Challenge
- Underutilization of Operating Rooms (ORs): Idle time and inefficient use of available ORs.
- Scheduling Inefficiencies: Manual scheduling led to fragmented information across systems.
- Extended Turnover Times: Causing delays between surgeries.
- Patient Risks: Delays increased risks and patient dissatisfaction.
- Lack of Real-Time Visibility: Limited ability to track and monitor OR schedules dynamically.
Scope of Project
- Implement a data-driven solutionto optimize operating room utilization.
- Provide real-time visibility into OR scheduling, staff allocation, and delays.
- Enable management to identify peak usage, idle times, and resource constraints.
- Incorporate predictive analytics to forecast demand and improve planning.
Solution Provided
A comprehensive Power BI dashboard was developed to unify operating room utilization data, surgical schedules, and staff assignments into a single view. The project involved preparing and integrating data from multiple sources, ensuring consistency and accuracy before visualization.
The dashboard was designed to track key KPIs such as utilization rates, turnover times, and schedule adherence, while offering real-time monitoring that enabled hospital administrators to quickly adjust resources and reduce delays.
To support long-term planning, predictive analytics were incorporated, leveraging historical patterns to forecast OR demand and identify recurring bottlenecks. The dashboards were also built with interactive features, allowing users to drill down by department, surgeon, or time period, transforming reporting into a powerful decision-support tool.
- Developed a Power BI dashboard integrating OR utilization data, surgical schedules, and staff assignments.
- Data Preparation: Collected, cleaned, and transformed data from multiple sources using Excel and integrated into Power BI.
- KPI Tracking: Monitored utilization rates, turnover times, and adherence to planned schedules. Real-Time Monitoring: Enabled quick adjustments to scheduling and resource allocation.
- Predictive Analytics: Forecasted OR demand based on historical usage patterns.
- Interactive Dashboards: Allowed hospital management to analyze data, reduce delays, and make informed decisions.
Business Impact
- Increased OR Utilization: Reduced idle time and improved resource usage.
- Improved Revenue & Efficiency: Optimized scheduling increased throughput, resulting in higher operational efficiency.
- Reduced Patient Wait Times: Faster scheduling and reduced delays improved patient satisfaction.
- Enhanced Decision-Making: Real-time dashboards empowered leadership with actionable insights.
- Future-Readiness: Predictive analytics provided a foundation for continuous process improvements.
Technical Architecture
- Visualization Tool: Power BI (with DAX functions, calculated columns, interactive dashboards).
- Data Source: Excel, hospital scheduling systems.
- Data Processing: Data cleaning, transformation, and integration workflows.
- Analytics: Real-time dashboards, KPI visualization, predictive analytics models.
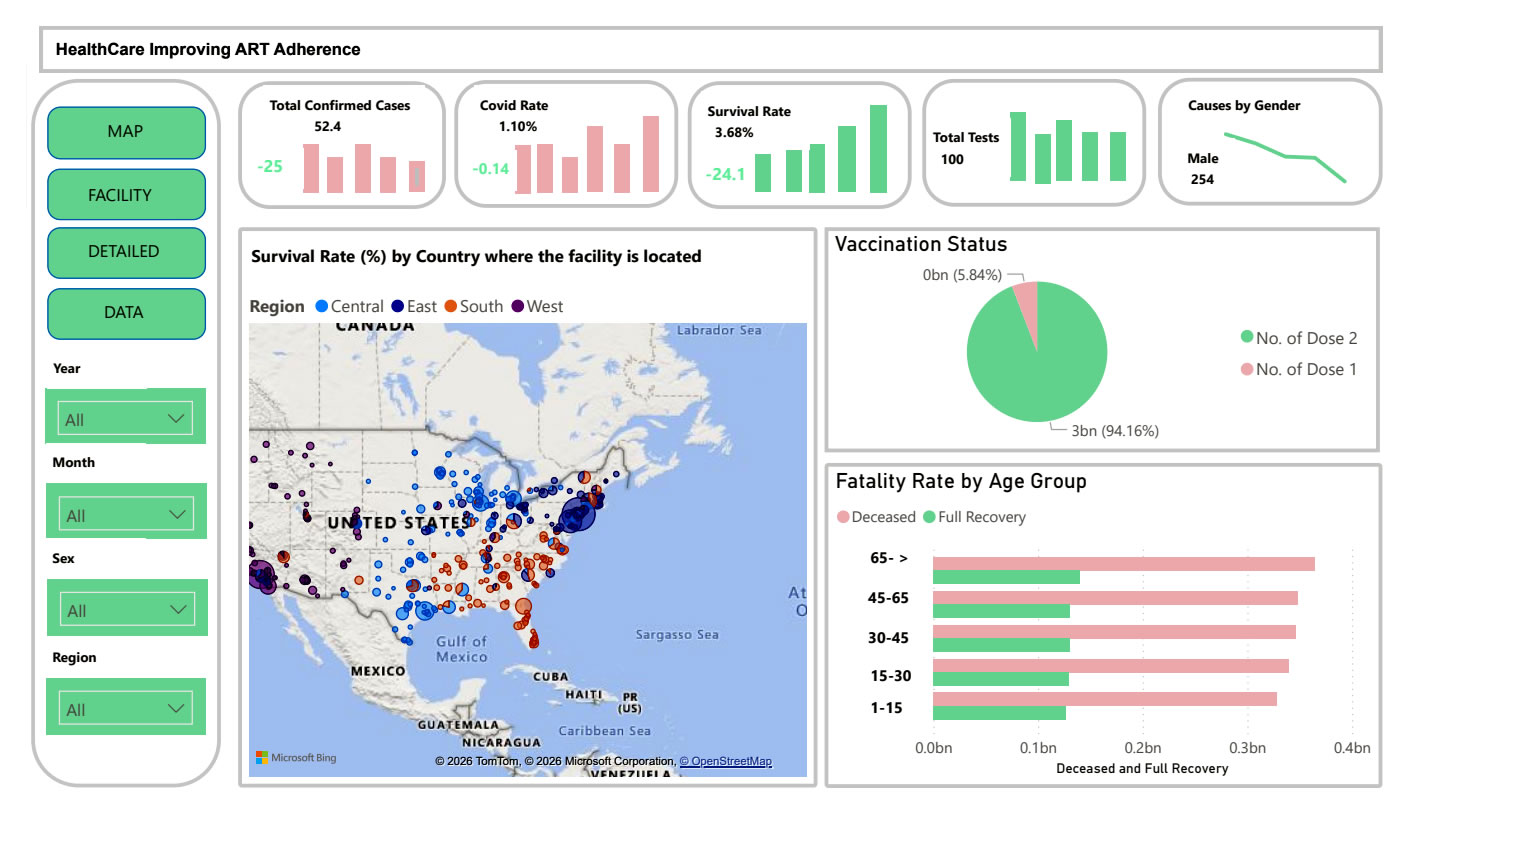
- HealthCare Improving ART Adherence
Challanges
Scope of Project
The project aimed to develop a real-time analytics solution that would enable healthcare providers to track ART adherence, monitor patient well-being, and manage the impact of external disruptions such as pandemics on treatment continuity. The focus was on creating a standardized, data-driven approach to improve patient support, optimize resource allocation, and ensure consistent healthcare delivery across all treatment centers.
Solution Provided
- A centralized Power BI dashboard was designed to bring together ART adherence data, patient well-being indicators, vaccination records, and regional performance metrics. This dashboard provided a unified view of treatment outcomes in near real time.
- Data preparation and integration involved consolidating information from multiple sources such as patient records, appointment logs, and survey data. This ensured that all metrics were accurate, up-to-date, and consistent.
- KPI monitoring allowed providers to track adherence levels, vaccination coverage, and treatment continuity, while automated alerts flagged at-risk patients requiring immediate follow-up.
- Power Apps forms were deployed to simplify data entry for healthcare staff, enabling quick updates on patient interactions, adherence checks, and follow-up visits.
- Interactive features allowed healthcare managers to drill down into specific clinics, demographic groups, or treatment outcomes, enabling precise interventions.
- Predictive analytics were applied to identify patients most likely to default on treatment, helping providers take preventive action.
Business Impact
- Improved adherence rates, reducing the risk of treatment failure and improving long-term health outcomes.
- Enhanced patient support, with early identification of mental health challenges such as anxiety and depression.
- Stronger continuity of care, with vaccination tracking and treatment monitoring reducing the risk of disruption.
- Efficient resource allocation, ensuring services were directed to the areas and patients that needed them most.
- Proactive decision-making, shifting the model from reactive crisis management to proactive healthcare delivery.
Technical Architecture
- Visualization & Analytics: Power BI (real-time dashboards, KPI monitoring)
- Data Collection & Entry: Microsoft Power Apps (for staff data input and patient updates)
- Data Storage & Collaboration: SharePoint (central repository and data sharing)
- Data Processing & Integration: Excel and survey datasets integrated into the BI platform
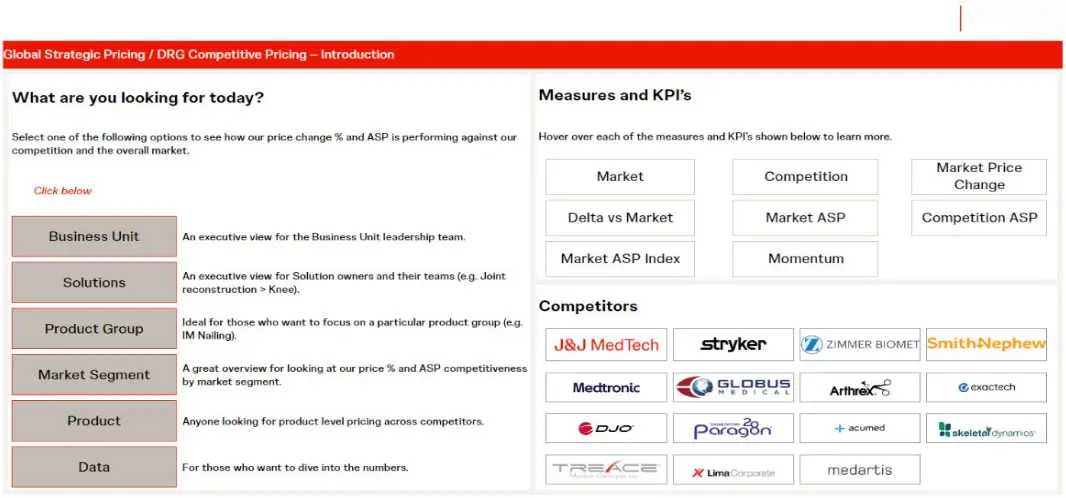
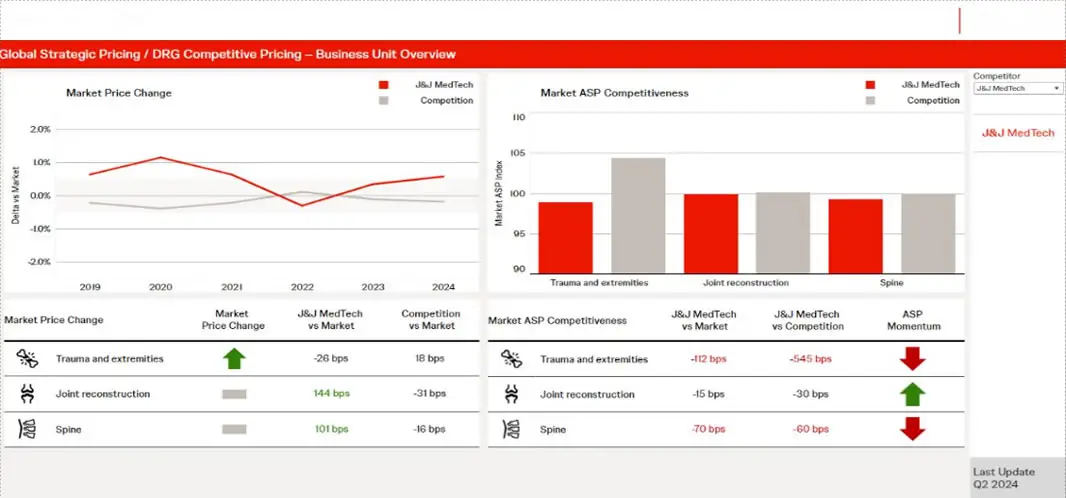
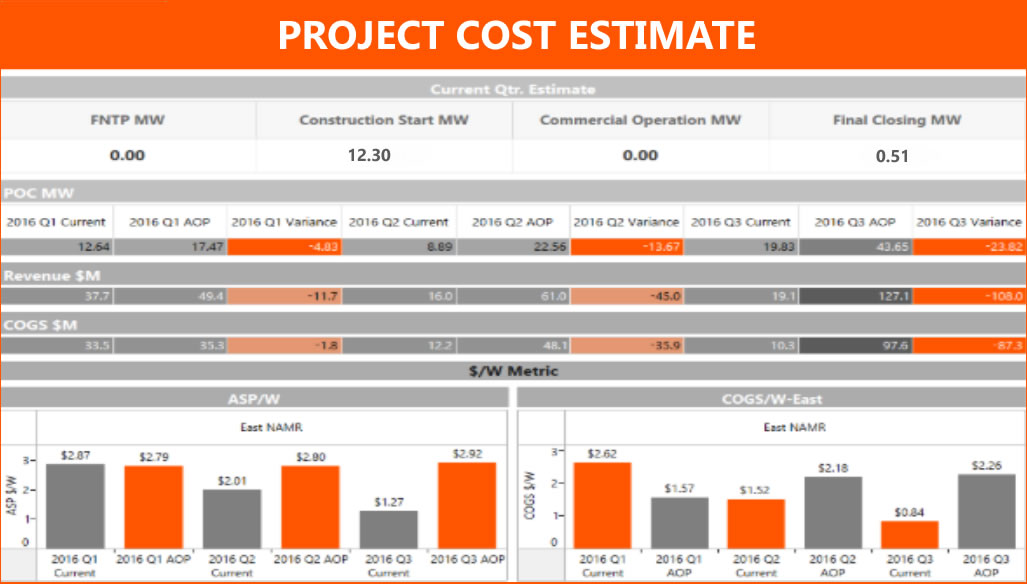
- Competitive Pricing Analytics
Challanges
The MedTech business faced significant hurdles in monitoring and comparing its pricing performance with competitors. There was limited visibility into Average Selling Price (ASP) and market pricing trends across platforms and regions. Competitor data was fragmented and difficult to access, making it challenging for business stakeholders to align their pricing strategies with market realities.
Without an integrated system, teams were spending significant time gathering data manually from disparate vendors and validating it, which delayed decision-making. The lack of real-time, reliable insights also reduced the ability to react quickly to market changes or competitive moves.
Scope of Project
- Deliver competitive ASP and market pricing comparisons at both the platform and overall business level.
- Enable leadership and sales teams to analyze performance against competitors on a yearly basis.
- Provide intuitive and interactive visualizations to support faster, data-driven decision-making.
- Establish a scalable and reliable architecture for continuous market insights.
Solution Provided
- Data Integration and Preparation
- Collected and consolidated pricing and market data from multiple external vendors such as DRG and ECRI.
- Data was ingested into Amazon Redshift where it was standardized, cleaned, and validated.
- Additional validation and cross-checks were performed using SQL queries and Excel-based rules to ensure accuracy.
- Visualization and Analytics
-
A Tableau dashboard was designed to display key pricing metrics including:
- Market Price (sales/volume by country, product hierarchy, and year).
- Construct ASP and ASP momentum.
- Competitive comparisons for ASP vs competition, both current and year-over-year.
- Dashboards were made interactive, allowing users to filter by country, region, platform, and competitor to quickly analyze specific market segments.
-
A Tableau dashboard was designed to display key pricing metrics including:
- Business Usability and Insights
- Provided a customer-centric market view, allowing pricing and sales teams to align strategies with competitive benchmarks.
- Incorporated ASP momentum tracking to evaluate changes against prior years and adjust pricing tactics.
- Enabled stakeholders to access dashboards through Tableau Server, ensuring real-time accessibility and collaboration across global teams.
- Scalability and Future Readiness
- The architecture was designed for easy expansion to include new vendors, additional geographies, and updated KPIs.
- Automated refreshes ensured that the dashboards always reflected the most current market data.
Business Impact
- Faster and Better Pricing Decisions: Decision-makers gained the ability to compare ASPs across competitors instantly, rather than relying on delayed manual reports.
- Improved Market Responsiveness:Real-time dashboards allowed pricing teams to react quickly to competitor moves and adjust strategies to maintain market competitiveness.
- Operational Efficiency: Reduced manual data collection and validation efforts, freeing up resources for deeper strategic analysis.
- Customer-Centric Insights: Sales and franchise teams could now align more closely with customer expectations and market dynamics, strengthening competitive positioning.
- Strategic Alignment: Leadership gained a consolidated view of global pricing performance, improving planning and forecasting accuracy.
Technical Architecture
- Data Storage & Processing: Amazon Redshift
- Data Validation: SQL, Excel
- Visualization & Reporting: Tableau (Scorecard dashboards, competitor ASP analysis, momentum tracking)
- Data Sources: Vendor-provided datasets (DRG, ECRI, and other MedTech market data)
- Deployment: Tableau Server for global accessibility and collaboration
- Enhancing Oil & Gas Field Intelligence through Real-Time Analytics and Dashboard Integration

The Challenge
Industry : Oil & Gas
- Aggregated reporting from diverse field devices.
- Integration of streaming video and SCADA data.
- Performance optimization of large-scale data reports.
- SharePoint portal integration for field users.
- Real-time analytics across multiple devices and systems.
Scope of Project
- Tableau Integration with SharePoint portal
- Tableau Server Authentication via Active Directory
- Big Data Hadoop connectivity for historical and streaming data
- Dashboard development for production analysis, loss code, and gas metrics
- Post-implementation support and training for internal teams
Solution
Key Deliverables:
- Developed Tableau dashboards for:
- Oilfield production by location
- Gas production metrics
- Loss code and event analysis
- Integrated Hadoop/HBase as a data source to manage large-scale field data.
- Designed efficient data schemas to enable scalable and performant queries.
- Created calculated fields, sets, parameters, and filters for deep-dive analytics.
- Embedded dashboards into the SharePoint portal for centralized access.
- Configured Tableau Server with user management, scheduling, and security.
- Enabled drill-down capabilities for teams to investigate root causes of incidents or downtime.
Business Impact
- Enhanced Operational Visibility: Real-time dashboards provided on-demand insight into oilfield performance and incident trends.
- Improved Decision-Making: Event management and emergency response teams could make faster, data-backed decisions.
- Scalable Reporting Infrastructure: Big Data integration ensured that massive datasets could be analyzed without latency.
- Streamlined Access: SharePoint integration allowed easy access for distributed teams.
- Reduced Downtime: Early detection of production issues helped minimize revenue losses.
Technology Environment
- Visualization & BI : Tableau Desktop, Tableau Server
- Data Infrastructure : Big Data Hadoop, HBase
- Portal & Collaboration : Microsoft SharePoint
- Authentication : Active Directory
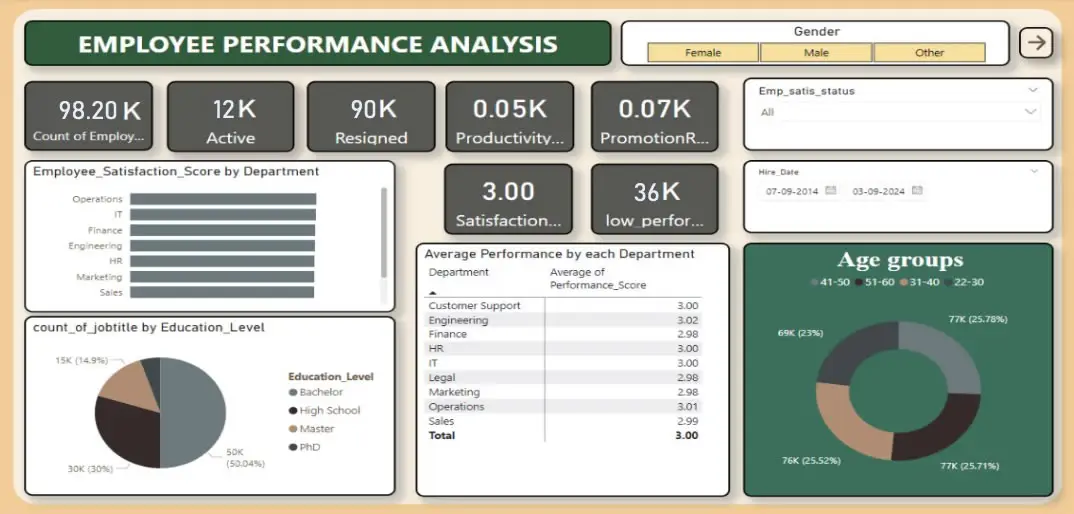
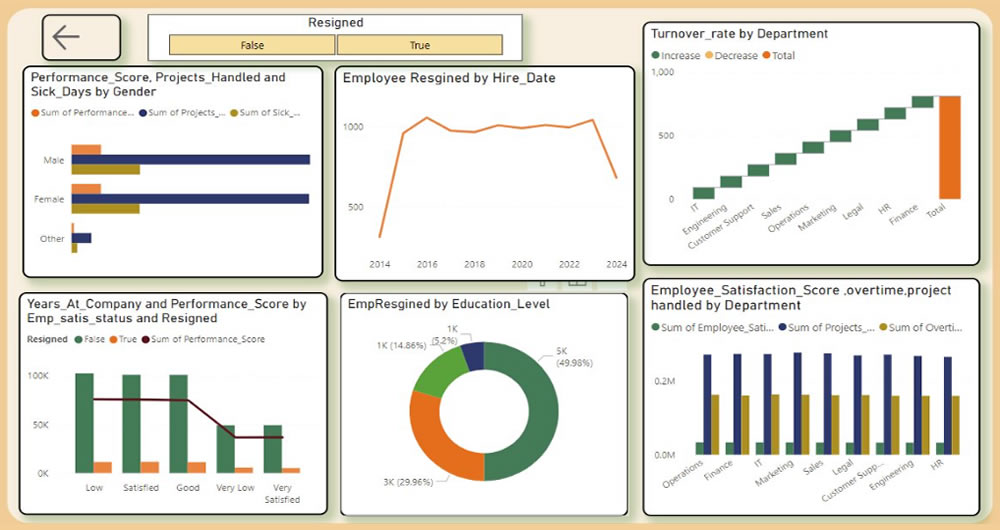
- HR Dashboard Analytics Implementation
The Challenge
The organization was experiencing high employee attrition, with nearly 90% of employees leaving. Despite a moderate productivity score, low employee satisfaction was evident, particularly in certain departments. Promotion and training opportunities were inconsistent, leading to dissatisfaction, low motivation, and uneven performance. The absence of data-driven decision-making made it difficult to identify the root causes of these issues, such as burnout, dissatisfaction, or workload imbalance.
Scope of the Project
- Reduce attrition and improve retention.
- Identify low-performing areas and underlying causes of dissatisfaction.
- Balance workloads and improve productivity.
- Create fairer promotion and recognition systems.
- Provide actionable insights to management for data-driven HR strategies.
The Solution
- Data Integration & Preparation: Employee data from multiple sources (Excel and internal HR systems) was collected, cleaned, and transformed. DAX functions were applied to calculate KPIs such as satisfaction scores, attrition rates, overtime hours, and promotion frequency.
- Workforce Insights: The dashboard provided department-level analysis of satisfaction scores, identifying areas with high dissatisfaction and turnover. These insights guided targeted retention programs, such as recognition initiatives and competitive promotions.
- Training & Development Monitoring: Gaps in training were identified, and standardized programs were recommended across departments to boost performance.
- Workload Balancing: Analysis of overtime and total work hours highlighted departments at risk of burnout. Workload was redistributed or additional hiring was suggested to balance productivity with well-being.
- Promotion & Recognition Fairness: Data revealed uneven promotion trends. Recommendations included implementing performance-based promotion policies to motivate employees and reduce dissatisfaction.
- Satisfaction Monitoring: Work-life balance and recognition initiatives were tracked, enabling HR teams to act quickly when scores declined.
business Impact
- Reduced Attrition: Identification of key attrition drivers allowed the organization to design targeted interventions, improving employee retention.
- Improved Productivity: Balanced workloads and expanded training initiatives enhanced overall workforce efficiency.
- Higher Employee Satisfaction: Recognition programs, fair promotions, and proactive monitoring raised satisfaction scores.
- Cost Savings: Lower recruitment and training costs due to reduced turnover.
- Data-Driven HR: Management gained real-time visibility into employee metrics, enabling smarter decisions.
Technology Used
- Data Source: Excel and internal HR systems
- Data Preparation & Transformation: Power BI (DAX functions, data modeling)
- Visualization: Power BI dashboards for HR, leadership, and department managers
- Analytics: Attrition analysis, satisfaction trends, workload distribution, promotion monitoring
- Human Resources

The Challenge
- Lack of centralized visibility into HR metrics (e.g. employee turnover, hiring pipeline, absenteeism, performance) across departments.
- Delayed or static reporting—HR reports were periodically generated (monthly or quarterly), limiting ability to respond quickly to emerging issues.
- Data silos—information about employee demographics, performance reviews, training, and attrition were stored in different systems, making it hard to correlate metrics.
- Difficulty identifying patterns or anomalies—for example sudden spikes in turnover, low training completion in particular teams, or high absenteeism—due to limited drill-down capability.
- Manual data processing burden—HR staff spent significant time aggregating and cleansing data to prepare reports.
Scope of the Project
- Build an interactive HR Dashboard to enable leadership and HR teams to monitor critical personnel metrics in near real time.
- Consolidate HR data from various sources (HRIS, performance management, recruiting, training, attendance systems).
- Provide visualizations for key metrics like headcount, attrition, hiring status, training compliance, employee performance, absenteeism.
- Enable filters and drill-down by department, location, role, time period to allow team-specific insights.
- Automate reporting and dashboards to reduce latency and manual work.
The Solution
- Designed and developed a Tableau-based HR Dashboard showing key HR metrics in an at-a-glance format:
- Employee headcount trends over time
- Turnover rates by department/location
- Hiring pipeline (open roles, candidates, time to hire)
- Training compliance and completion rates
- Absenteeism and leave trends
- Performance rating distributions and evaluation status
- Data integration: pulled together data from HRIS, recruiting systems, attendance / time tracking tools, learning management systems, performance review platforms.
- Data transformation and preparation: standardizing employee role titles, handling missing data, ensuring consistency in categorization (locations, departments).
- Dashboard interactivity: filters by department, location, role, time period; ability to drill down into specific groups; comparisons over time (month-over-month, year-over-year).
- Automated refresh: schedule data extracts and refreshes to keep dashboards up to date.
- Visualization design: user-friendly layout, clear KPIs, color-coded alerts or signals for metrics outside of thresholds.
Business Impact
Impact Area | Results / Benefits |
Improved Decision-Making | HR leadership can now identify rising turnover in specific departments early, enabling targeted interventions before loss becomes critical. |
Efficiency Gains | Reduced time for HR reporting by ~50–70%, freeing HR team to focus on strategic initiatives rather than manual data compilation. |
Better Visibility | Continuous visibility into hiring pipelines helps avoid staffing shortages and react faster when hiring lags. |
Training Compliance | With dashboard tracking, increased training completion rates and better compliance with required learning modules. |
Reduced Absenteeism Impact | Monitoring absenteeism patterns allowed HR to spot problematic trends (departments with high unscheduled leave) and address underlying causes. |
Employee Engagement & Retention | Transparent performance review metrics and faster resolution of HR issues improve employee satisfaction and retention. |
Technology Used
- Visualization / BI Tool: Tableau Desktop / Tableau Server (or Tableau Online)
- Data Sources: HR Information System (HRIS), Recruiting / ATS system, Learning Management System (LMS), Attendance / Time Tracking, Performance Review Tools
- Data Storage / ETL: SQL Database / Data Warehouse for staging and integrating HR data; data cleaning and transformation pipelines
- Automation / Scheduling: Automated extracts / refresh schedules for dashboard data to remain current
- User Access & Security: Role-based dashboard access, filters to control visibility (e.g., managers see only their own team data)
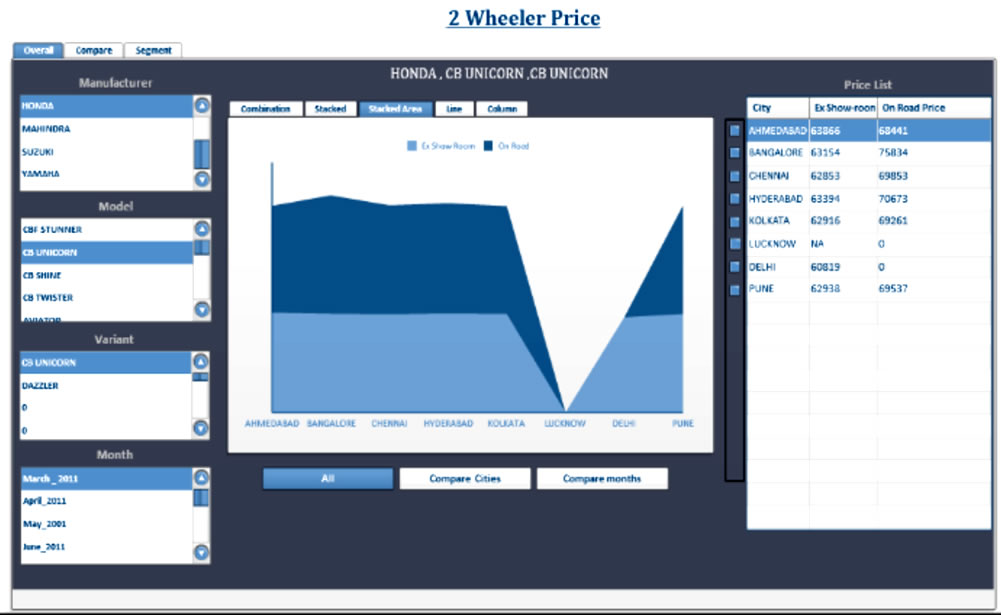
- Automobile Industry BI Integration
The Challenge
- Enabling comparisons of pricing trends across competitors and different months.
- Ensuring seamless integration of BusinessObjects (BO) with the existing platform.
- Implementing custom authentication and security controls to align with the company’s policies.
- Validating cube designs, hierarchies, and calculated measures to ensure reporting accuracy.
- Improving processing and query performance for end users.
Solution
The project involved a complete lifecycle implementation of BO integration with the client’s existing platform. Key activities included:
- BO Integration & Authentication
- Configured and integrated BusinessObjects with the existing platform.
- Implemented custom authentication mechanisms on BO Server to align with enterprise security policies.
- Data Security & Access Control
- Designed and validated cube roles and user group matrices.
- Ensured cube-level and report-level security to protect sensitive pricing data.
- Cube Design Validation
- Validated measures, dimensions, hierarchies, and calculated fields within the OLAP cubes.
- Ensured accuracy of pricing and comparison analytics.
- Performance Optimization
- Tuned cube processing and query performance, reducing report response times.
- Post-Implementation Support
- Provided ongoing support for BO integration, troubleshooting, and enhancements.
Business Impact
- Business Impact Enhanced Pricing Transparency: Enabled management to compare on-road and ex-showroom prices across competitors and timeframes, leading to more informed pricing strategies.
- Stronger Data Security: Custom authentication and role-based security ensured sensitive pricing information was only accessible to authorized users.
- Improved Performance: Optimized cube and query processing reduced reporting time by over 45%, ensuring faster decision-making.
- Seamless Integration: Successful BO integration with the existing platform ensured smooth user adoption without disrupting business operations.
- Scalable Analytics Framework: The solution provided a foundation for expanding analytics into other business areas beyond pricing.
Technology Environment
- Business Intelligence Tools: BusinessObjects, Xcelsius 2008
- Integration: OLAP Analysis, Custom BO Server Authentication .
- Insurance Sector Data Analytics Enhancement
Industry :
Insurance & Financial Services
The Challenge
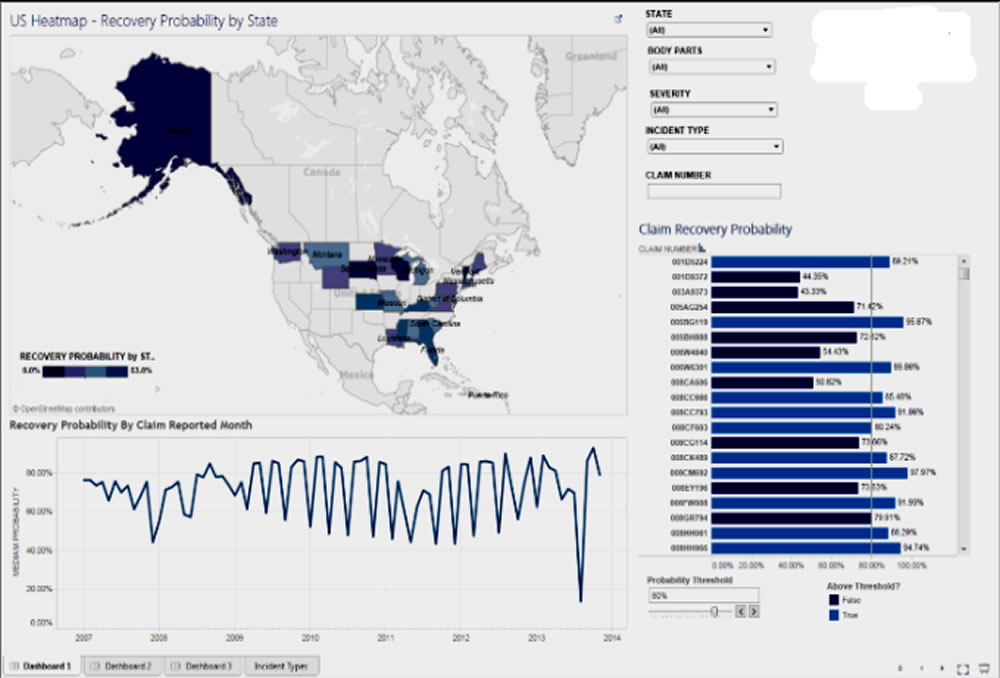
The client’s secure, integrated application supported core business functions such as claims management, recovery tracking, severity analysis, and branch-level operations. However, they faced:
- Performance issues in Tableau dashboards, causing delays in accessing critical insights.
- The need to develop multiple reports and dashboards to analyze claims, severity, and probability thresholds across various locations.
- Limited ability to dynamically adjust and analyze recovery metrics based on different operational parameters.
The Solution
- Data Aggregation & Visualization
- Designed and implemented optimized data aggregations for Tableau Dashboard and Tableau Server to handle large datasets efficiently.
- Created interactive reports for claims, severity, and recovery probability analysis.
- Predictive Recovery Model
- Built a model to predict claim recovery probability, categorizing claims into recovery probability buckets for proactive follow-up.
- Dynamic Analysis Parameters
- Introduced parameters for Loss Amount, Recovered Amount, Recovery Probability, and Probability Threshold to allow flexible, scenario-based analysis.
- Quality & Performance Improvements
- Developed quality-check reports to validate aggregated data accuracy.
- Resolved a large backlog of critical reporting issues.
- Performance-tuned slow-running dashboards and recommended database design changes to improve query speed.
- Stakeholder Collaboration
- Worked closely with business teams to gather evolving requirements and implement enhancements iteratively.
Business Impact
- Improved Decision-Making : The predictive recovery model enabled data-driven prioritization of recovery efforts, leading to faster claim resolution.
- Increased Reporting Efficiency : Dashboard load times were reduced by over 60%, enabling real-time access to operational insights.
- Operational Flexibility : Dynamic parameters empowered analysts to explore multiple recovery and loss scenarios without additional development effort.
- Enhanced Data Reliability : Quality validation processes ensured higher accuracy in financial and operational reporting.
- Scalable Architecture : The optimized design allowed easy addition of new reporting dimensions and metrics in the future.
Technology Environment
- BI & Visualization: Tableau Desktop, Tableau Server
- Database: SQL Server 2008
- Telecommunication
The Challenge
The telecom company is struggling with high customer churn rates, where customers frequently switch to competitors by porting their SIM cards, leading to significant revenue loss and profitability challenges.
- Fragmented Data Sources
- Lack of Predictive Insights
- Ineffective Retention Campaigns
- Delayed Decision-Making
- High Customer Acquisition Costs
- Customer Dissatisfaction
Scope Of Project
- Identify high-risk customers through Data analytics.
- Centralized Data Integration.
- Customer Segmentation for Personalized Campaigns.
- Monitor churn trends in real-time dashboards.
- Proactive Alerts and Automation
Business Problem
The telecom company faced high customer churn rates, leading to revenue loss and increased operational costs
The Solution
Implementing a churn analytics solution using Power BI to address the challenges.
- Predictive Analytics for Churn Prediction:
- Forecast models were developed to identify high-risk customers based on usage patterns, complaints, and payment behavior.
- Customer Segmentation:
- Customers were grouped by demographics, service usage, and preferences, enabling targeted retention efforts.
- Personalized Retention Campaigns:
- Tailored offers, service upgrades, and promotions were deployed to at-risk customers, enhancing engagement and reducing churn.
- Proactive Decision-Making:
- Automated alerts were set up for key stakeholders, ensuring timely actions to retain customers before they churn.
Implementation
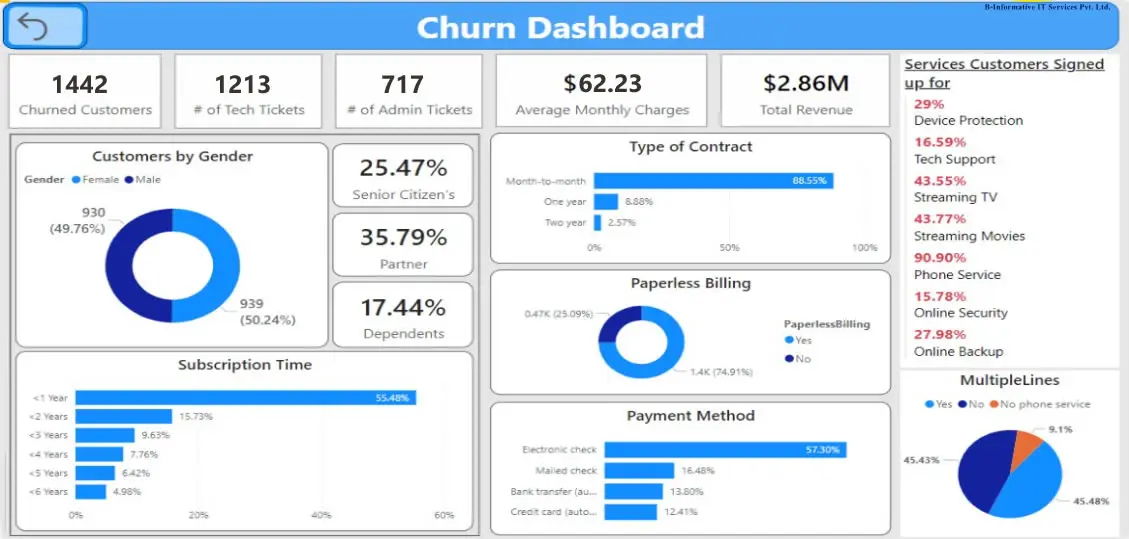
- Began by analyzing Telecom customer dataset that included key features like customer demographics, tenure, services signed up for, and churn status.
- Using Power BI, I cleaned the data and created relevant calculated columns and measures to capture customer behaviors such as service utilization, and tenure metrics.
- Key performance indicators like average tenure, churn risk percentage, customer retention rates, and service usage were
presented in Power BI dashboards.
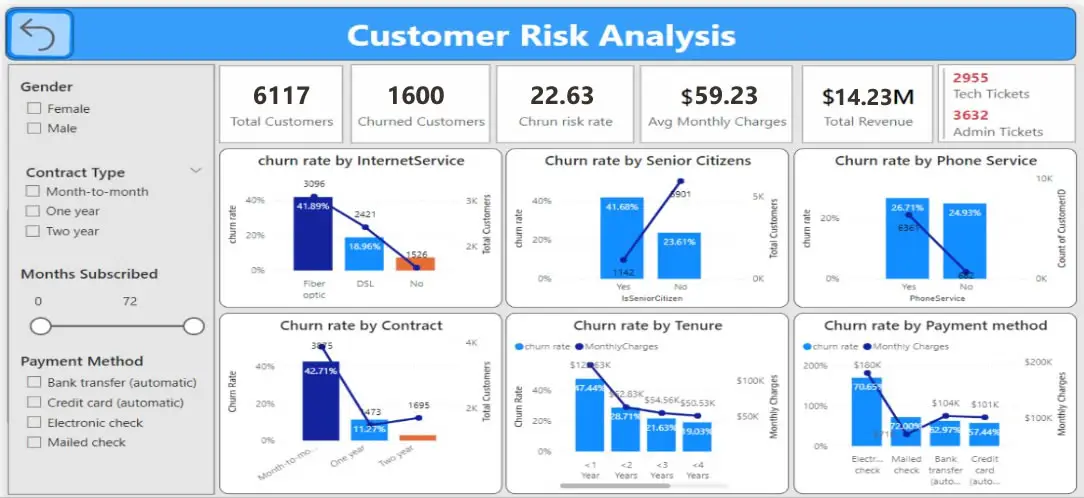
Business Impact
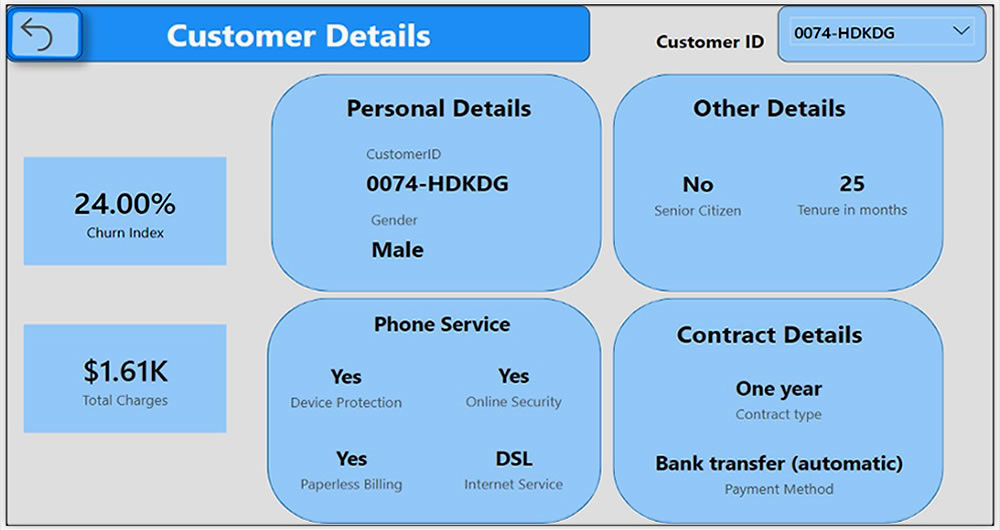
- The solution provided a clear understanding of individual customer churn risks based on historical data, service usage,
and demographics. - The interactive Power BI dashboard allowed stakeholders to drill down into specific customer segments and evaluate the
effectiveness of different services and contracts. - The integration of metrics like churn risk and tenure allowed for the automation of identifying at-risk customers, enabling
proactive outreach and support. - This helped improve resource allocation and customer engagement strategies, resulting in reduced churn and higher
retention rates.
Technology USED
- Power query, Power Bi , SQL Server
- Energy Sector Digital Transformation
Industry
- Energy & Renewable Solutions
The Challenge
The client needed a centralized platform to efficiently create, manage, and monitor solar energy projects. Key requirements included:
- Project creation and management within a custom application.
- Detailed costing breakdown for each project segment.
- Dynamic project creation forms that adapt based on project type (e.g., Ground Mount, Rooftop, Canopy).
- Ability to assign projects to specific users depending on their roles.
The existing process lacked automation, dynamic data handling, and performance-optimized reporting, making it difficult to track progress, costs, and recovery rates effectively.
The Solution
The engagement involved architecting, designing, and implementing robust data aggregation and visualization capabilities, alongside predictive analytics. The key steps included:
- Tableau Dashboard & Server Implementation
- Designed and deployed interactive dashboards for project tracking, cost analysis, and recovery forecasting.
- Predictive Recovery Model
- Built a model to predict the probability of recovering claims, allowing classification into recovery probability buckets and enabling proactive decision-making.
- Quality & Performance Optimization
- Developed quality check reports to ensure accuracy of aggregated data.
- Performance-tuned slow-running reports, improving data retrieval times significantly.
- Recommended and implemented critical database design changes for efficiency.
- Requirement Analysis & Iterative Enhancements
- Collaborated with business stakeholders to capture evolving requirements.
- Analysed, designed, and implemented feature enhancements based on operational needs.
Business Impact
- Enhanced Decision-Making : The predictive model provided actionable insights into claim recovery likelihood, helping prioritize recovery efforts and reduce losses.
- Operational Efficiency : Dynamic forms and role-based project assignment streamlined project creation and tracking, cutting down administrative time.
- Faster Reporting : Optimized dashboards and database design reduced report load times by over 50%, ensuring timely access to critical project data.
- Improved Data Accuracy : Quality-check mechanisms minimized reporting errors, boosting trust in analytics outputs.
- Scalability : The architecture allowed for easy integration of new project types and reporting requirements, future-proofing the system.
Technology Environment
- BI & Visualization: Tableau Desktop, Tableau Server
- Database: SQL Server 2008
- Real Estate Digital Property Platform Analytics
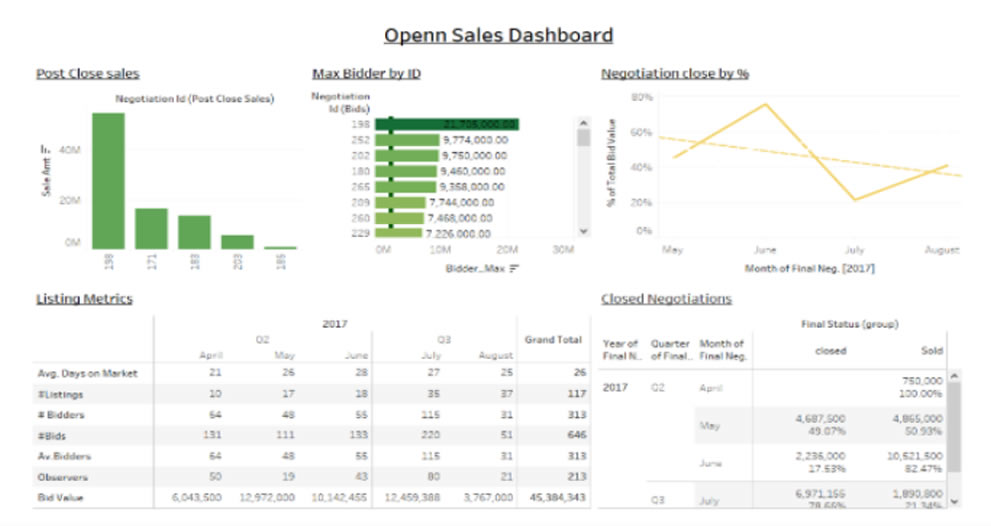
The Challenge
The client was developing an online property purchasing platform aimed at creating a transparent and fair marketplace for buyers and sellers. Managed by real estate professionals, the platform allowed qualified buyers to openly negotiate prices while seeing the number of competing buyers in real time.
The challenges included:- Designing and implementing Tableau dashboards to provide real-time insights.
- Managing Tableau Server operations, including user creation, authentication, project setup, and backup.
- Ensuring accurate data aggregation and reporting.
- Understanding and adapting to the complex architectural requirements for Tableau dashboard and server integration.
Solution
A complete BI solution was delivered using Tableau for visualization and SQL Server for data management. Key actions included:
- Dashboard Development
- Designed interactive Tableau dashboards providing property negotiation insights, buyer competition trends, and pricing analytics.
- Server & User Management
- Managed Tableau Server, handling user and project creation, authentication setup, and system backup for business continuity.
- Data Aggregation & Quality
- Implemented and documented robust aggregation processes for data accuracy.
- Developed quality-check reports to validate aggregated datasets.
- Business Requirement Alignment
- Collaborated with business stakeholders to gather evolving requirements.
- Designed and implemented enhancements to support new use cases and reporting needs.
Business Impact
- Transparency & Trust: The dashboards enhanced platform credibility by allowing buyers and sellers to see real-time insights on competition and pricing.
- Improved Decision-Making: Accurate, quality-checked reports empowered real estate agents and buyers with reliable data for negotiations.
- Operational Efficiency: Centralized Tableau Server management streamlined user access, security, and reporting consistency.
- Scalable Reporting: The flexible architecture allowed the platform to easily incorporate new metrics and reporting needs.
- Enhanced User Engagement: The visual insights increased buyer confidence, resulting in higher participation rates on the platform.
Technology Environment
- Visualization: Tableau Desktop, Tableau Server
- Database: MS SQL Server
- Real Estate Analytics Dashboard Implementation
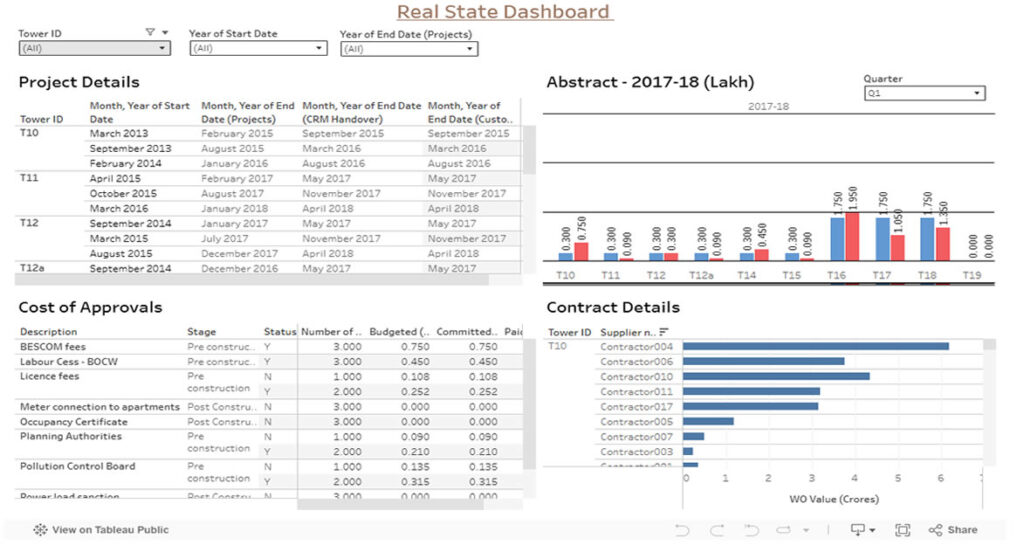
Executive Summary
A leading real estate development and investment company implemented a comprehensive Tableau-based analytics dashboard solution to transform their data-driven decision-making capabilities across multiple departments. The initiative addressed critical challenges in data fragmentation, manual reporting processes, and lack of real-time visibility into business operations, delivering significant ROI and competitive advantages.
About the Organization
The Challenge
- Critical business data scattered across multiple systems and platforms
- Excel-based reporting processes consuming 15-20 hours per week per department
- Risk of human errors in data compilation and analysis
- Delayed insights leading to missed opportunities in fast-moving real estate market
- No real-time tracking of project milestones and budget adherence
- Challenges in monitoring sales pipeline and conversion rates
- Lack of visibility into marketing campaign effectiveness
- Executive leadership lacked comprehensive operational dashboards for strategic decision-making
Solution
The organization implemented a multi-tiered Tableau dashboard solution encompassing five key areas:
Sales Performance Dashboard- Real-time sales metrics: property listings, sales volume, conversion rates
- Agent performance tracking and pipeline management
- Customer analytics and geographic performance analysis
- Campaign performance and ROI tracking across all channels
- Lead generation metrics with source attribution and quality scoring
- Website analytics and social media performance monitoring
- Timeline tracking with project milestones and delivery schedules
- Budget vs. actual financial performance monitoring
- Resource allocation and risk assessment capabilities
- Revenue analysis at property-level and portfolio performance
- Expense tracking, cash flow management, and investment ROI metrics
- Budget variance analysis and predictive financial modeling
- Consolidated KPIs across all departments
- Market intelligence and competitive analysis
- Strategic metrics for long-term growth and investor reporting
Business Impact
- 75% reduction in time spent on manual reporting processes
- 60% faster monthly close cycles through automated financial reporting
- 40% improvement in data accuracy and consistency across departments
- 50% reduction in ad-hoc data requests to IT department
- 25% increase in sales conversion rates through improved lead tracking
- 30% growth in average deal size due to better customer insights
- 40% increase in marketing campaign effectiveness
- 25% reduction in customer acquisition costs
- 20% reduction in sales cycle length via enhanced pipeline management
- 20% improvement in project delivery timelines
- 15% reduction in project budget overruns
- 18% increase in overall profit margins through better cost management
- 22% improvement in portfolio ROI tracking and optimization
- 30% faster financial decision-making through real-time insights
- Enhanced Decision-Making: Real-time access to critical business metrics enabling agile decision-making
- Improved Stakeholder Communication: Standardized investor reporting reducing preparation time by 60%
- Competitive Advantage: Faster response to market opportunities and better understanding of customer preferences
- Cultural Transformation: Data-driven culture adoption across the organization
Implementation Approach
- Stakeholder interviews and requirements gathering
- Data source identification and technical architecture design
- Project team formation and initial training
- Dashboard development with iterative testing
- Data integration and validation processes
- User acceptance testing and comprehensive training programs
- Production deployment with performance optimization
- Continuous improvement based on user feedback
- Advanced analytics and machine learning integration
- Scalability enhancements for future growth
Key Success Factor and Lessons Learned
- Executive Sponsorship: Strong leadership support was crucial for organization-wide adoption
- User-Centric Design: Involving end-users in design process ensured practical functionality
- Data Quality Focus: Investing in data cleansing and validation prevented future issues
- Phased Approach: Gradual rollout allowed for learning and adjustment during implementation
- Established clear data governance policies and procedures
- Implemented robust security and access control measures
- Created a center of excellence for ongoing dashboard management
- Prioritized comprehensive user training and change management
- Advanced Predictive Analytics: Machine learning models for market forecasting and risk assessment
- IoT Integration: Smart building data integration for operational optimization
- External Data Enhancement: Third-party market data and economic indicators integration
- AI-Powered Insights: Automated anomaly detection and recommendation engines
Conclusion
The Tableau-based real estate analytics dashboard implementation delivered transformative results across all business dimensions, demonstrating measurable ROI through:
- Operational Excellence: 75% reduction in manual reporting time and 40% improvement in data accuracy
- Revenue Growth: 25% increase in sales conversion rates and 30% growth in average deal size
- Cost Optimization: 25% reduction in customer acquisition costs and 18% increase in profit margins
- Strategic Advantage: Enhanced decision-making capabilities and competitive market positioning
The comprehensive approach to dashboard development, focusing on user needs and business outcomes, positioned the organization for sustainable competitive advantage through enhanced data-driven decision-making capabilities. This case study demonstrates the transformative power of well-implemented business intelligence solutions in the real estate industry, providing a blueprint for organizations seeking to leverage data analytics for operational excellence and strategic growth.
The solution not only addressed immediate operational challenges but also established a foundation for future innovation through advanced analytics, predictive modeling, and AI-powered insights, ensuring continued value realization and competitive advantage in the dynamic real estate market.
- Project Status Tracking and Performance Visualization
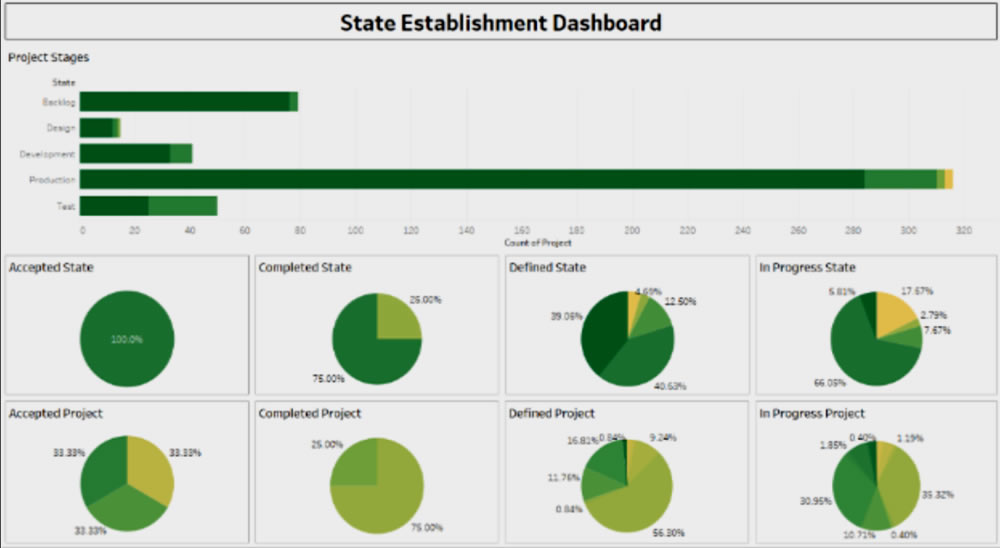
The Challenge
- How projects were progressing through different stages (Backlog, Design, Development, Production, Testing).
- The percentage of work completed, in progress, or delayed.
- Consolidation of data coming from multiple systems into a single, actionable view.
Scope
Key objectives:
- Consolidate data from multiple sources into a standardized reporting format.
- Provide visibility into project stages and departmental performance.
- Automate reporting to reduce manual effort and human error.
- Deliver actionable insights for better resource allocation and planning.
Solution
A Tableau-based analytics solution was implemented to address these challenges:
- Dashboard Design & Implementation
- Built interactive dashboards in Tableau Desktop to visualize project progress.
- Created tabular reports and integrated them into dashboards for quick insights.
- Displayed project stages (Backlog, Design, Development, Production, Testing) with real-time status tracking.
- Developed KPIs to show project percentages (Accepted, Completed, Defined, In-Progress).
- Data Integration & Cleansing
- Integrated multiple data sources into a single, centralized platform.
- Conducted extensive data extraction, transformation, and cleansing to ensure accuracy.
- Deployment & Scalability
- Published dashboards to Tableau Server for enterprise-wide access.
- Enabled drill-down analysis for department-level performance tracking.
Business Impact
Impact Area | Results Achieved |
Project Visibility | Achieved complete visibility of all projects across departments, improving transparency. |
Decision-Making | Reduced time to identify project delays and bottlenecks, enabling faster resource allocation. |
Operational Efficiency | Eliminated manual project tracking processes, saving 40% of reporting effort. |
Data Accuracy | Improved reporting accuracy through automated data integration and cleansing. |
Performance Monitoring | Real-time project metrics allowed leadership to track growth and project health at any time. |
Cross-Team Collaboration | Created a unified source of truth, improving communication and accountability between departments. |
Technology Environment
- Visualization & Analytics: Tableau (core dashboard platform).
- Data Sources: MES, ERP, SCADA, Quality Systems.
- Data Integration: ETL pipelines for real-time feeds.
- Database: SQL-based storage for structured production and quality data.
- Travel & Tourism Industries
The Challenge
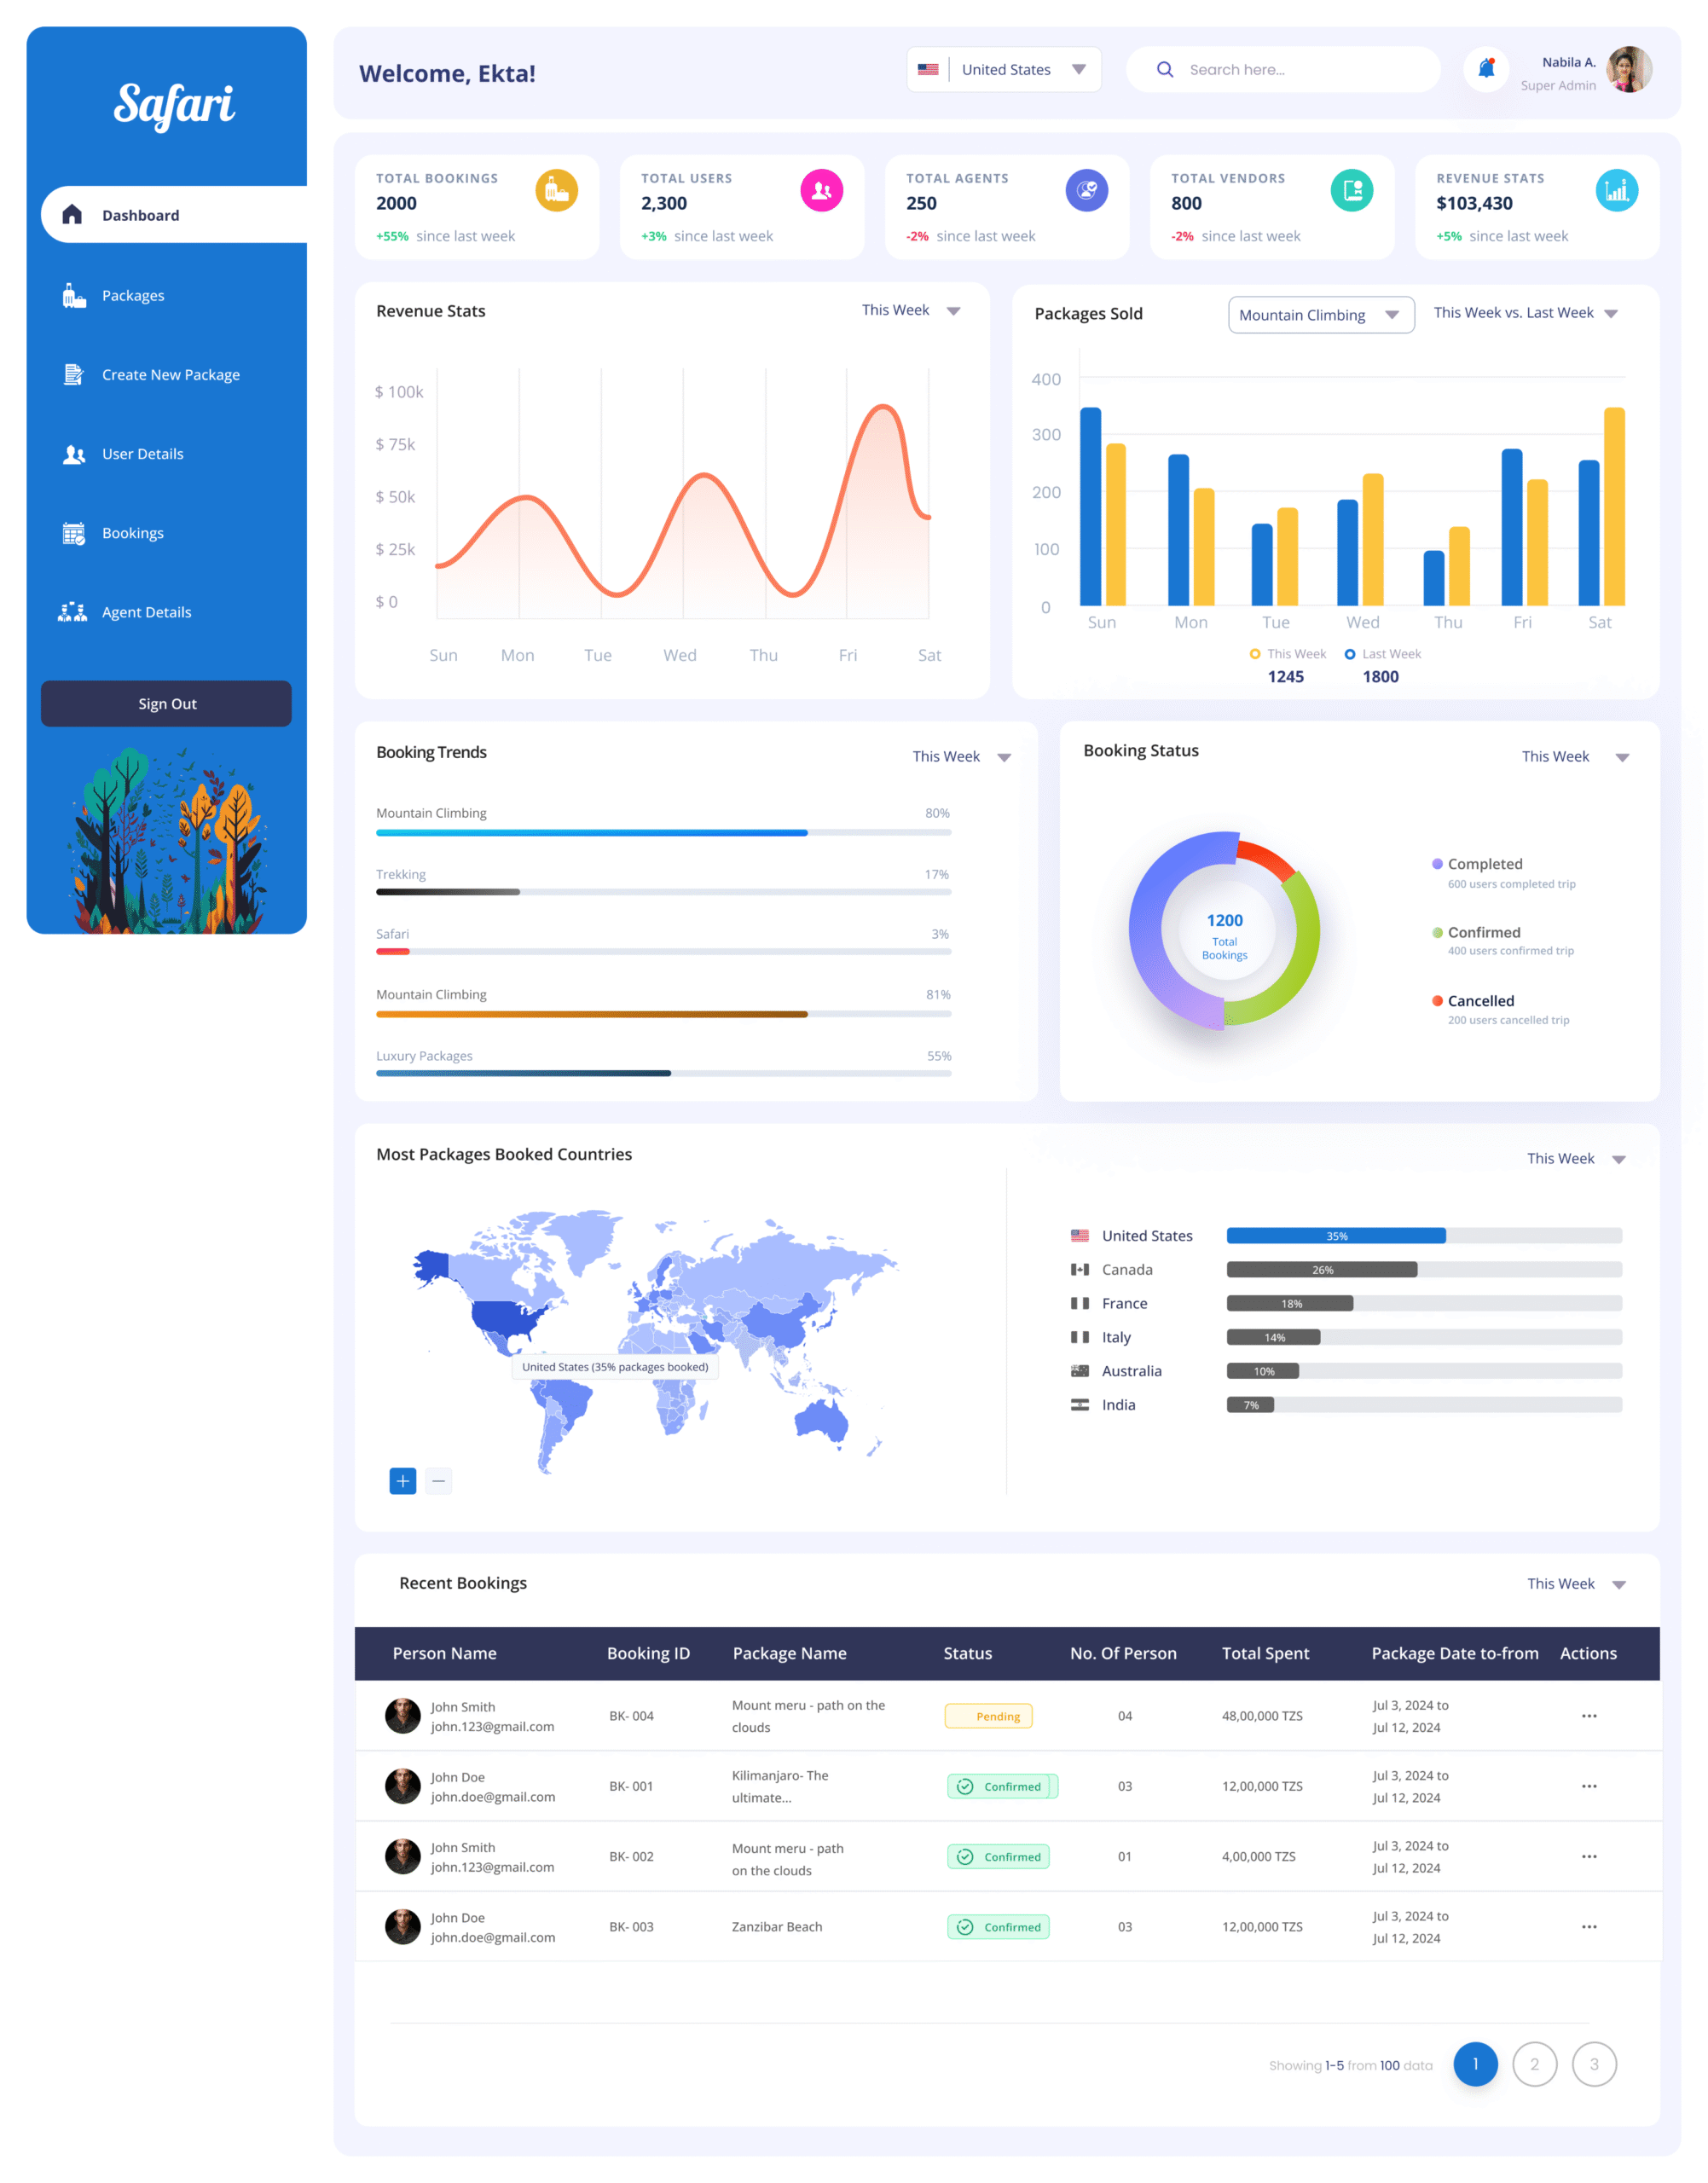
- The client required a modern, centralized platform to manage the entire travel ecosystem—including package creation, agent management, user tracking, booking monitoring, and revenue insights. The challenge was to simplify a multi-role, data-intensive workflow into an interface that remained clean, informative, and scalable for future features.
Scope Of Project
- Design a unified dashboard for Admins and Super Admins to monitor all travel operations.
- Provide modules to manage packages, agents, users, vendors, and bookings.
- Visualize booking and revenue performance trends.
- Integrate location-wise analytics to determine top-performing regions.
- Enable intuitive workflows for package creation and status monitoring.
The Solution
- Dashboard Overview Panels
- Designed top summary cards showing Total Bookings, Users, Agents, Vendors, and Revenue.
- Used color-coded indicators (+/-%) for week-over-week performance.
- Revenue & Package Performance Graphs.
- Implemented line charts for revenue stats and bar charts for packages sold—segmented by travel types (e.g., Mountain Climbing, Safari).
- Enabled toggle between “This Week” and “Last Week” comparisons.
- Real-Time Booking Tracker
- Used pie charts to visualize booking status (Completed, Confirmed, Cancelled).
- Booking trends displayed using horizontal bars for percentage breakdowns by package.
- Recent Bookings Table
- Included columns for Booking ID, Package Name, Status, Persons, Total Spent, Date Range.
- Status tags (e.g., Pending, Confirmed) with visual indicators.
- Geo Insights Panel
- World map integration to visualize most booked countries.
- Country-wise booking data displayed with proportional bars.
- Navigation & Workflow Enhancements
- Sidebar navigation grouped by tasks: Create Package, Agent Details, User Details, Bookings.
- Added pagination in tables for handling large datasets efficiently.
- Search bar and country selector for quick filtering.
Technology USED
- Figma, Adobe XD for Mockups, Prototype, And Handoff
This is the heading
Lorem ipsum dolor sit amet, consectetur adipiscing elit. Ut elit tellus, luctus nec ullamcorper mattis, pulvinar dapibus leo.
All the reasons to choose BIITS.
B-Informative IT Services Pvt. Ltd. (BIITS) is an award-winning Business Intelligence & Digital & Consulting company based out of Indian Silicon Valley, Bangalore. We are a team of motivated professionals with expertise in different domains and industries. We help our clients to derive simplified and conclusive data insights for effective decision making.