- Credit Management Dashboard
The Challenge
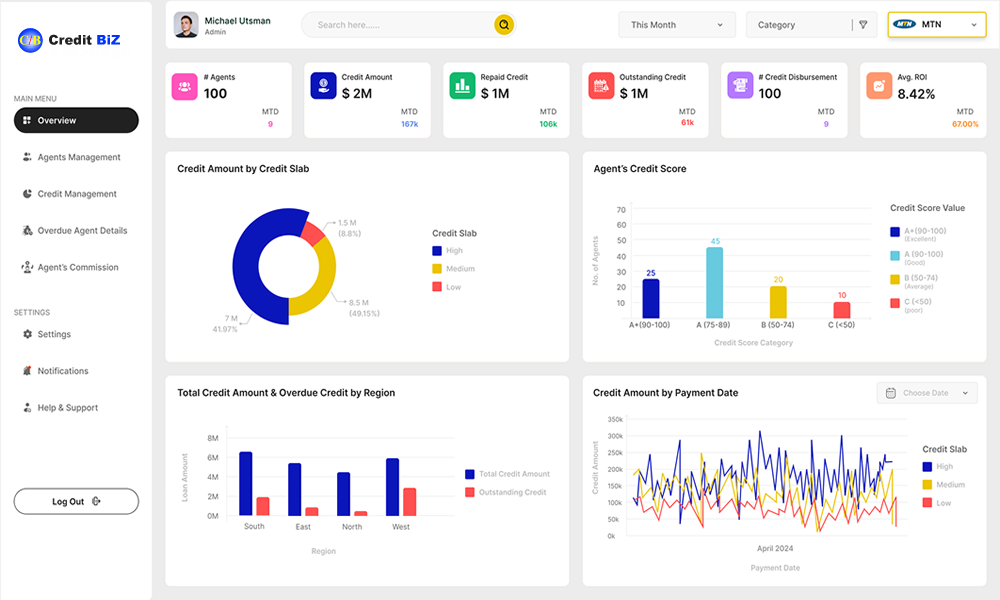
The client required a centralized platform to manage their microfinance credit ecosystem—including agent performance, credit disbursement, repayment tracking, defaulter monitoring, and commission insights. The main challenge was consolidating fragmented credit data and enabling real-time visibility into repayments, overdue credits, and portfolio risk while keeping the interface clean and scalable.
Scope of the Project
– Provide modules to manage agents, track credit disbursements, repayments, and commissions.
– Enable defaulter identification with overdue and repayment trend tracking.
– Integrate regional and risk-based analytics to monitor performance variations.
– Design workflows for real-time monitoring and proactive intervention.
The Solution
– Summary cards for Total Agents, Credit Issued, Amount Repaid, Outstanding Amount, Disbursements, and ROI.
– Color-coded indicators for MTD performance tracking.
Credit & Risk Analytics
– Donut and bar charts for credit distribution by risk slabs (High, Medium, Low).
– Time-series graphs for repayment trends and overdue amounts.
Defaulter Tracking
– Automated alerts for overdue repayments.
– Drill-down views to identify high-risk agents and borrowers.
Agent & Commission Management
– Agent scorecards with performance ratings (A+ to C).
– Commission tracking linked to disbursement and repayment success.
Regional Insights
– Maps and charts showing credit distribution and overdue patterns by region.
– Comparative analysis to identify underperforming areas. Navigation & Workflow Enhancements
– Sidebar navigation for Credit Management, Agent Details, Defaulter List, and Reports.
– Search and filters for quick access to agent or regional data.
– Pagination and export options for handling large datasets.
Business Impact
– Better Risk Management: Early detection of defaulters lowered credit default rates by 25%.
– Increased Transparency: Real-time monitoring boosted trust between supervisors and agents.
– Revenue Growth: Smarter commission tracking increased agent performance and repayment rates.
– Scalability: A future-ready system that can expand with growing credit portfolios.
Technology Used
- – React.js
- – Django Rest Framework
- Healthcare
The Challenge
Building this solution involved navigating multiple complexities. The system required seamless integration of AI-driven conversations with real-time human intervention, especially in oncology-related queries, where accuracy and empathy were equally critical. Designing a scheduling and consultation engine that could adapt across time zones, prevent conflicts, and still offer flexibility for rescheduling was demanding. Ensuring secure video consultations with features like waiting lobbies, chat, and recording added another layer of intricacy. Beyond functionality, safeguarding patient data under strict compliance frameworks meant encryption, consent validation, audit logs, and role-based controls had to be tightly woven into the architecture. Scaling the platform to handle growing user volumes while maintaining low latency, reliable performance, and extensibility for future AI-driven insights further amplified the challenge. Above all, achieving a balance between patient empowerment, specialist efficiency, and administrative transparency required meticulous design and rigorous development efforts.
Scope of the Project
The solution was envisioned to deliver:
- Centralized Role Management for patients, experts, and administrators.
- Conversational AI Integration to provide accurate responses and route sensitive cases to experts.
- Scheduling & Consultation Engine supporting real-time availability, bookings, reminders, and video sessions.
- Operational Dashboards with KPIs, revenue analytics, appointment trends, and compliance-ready reporting.
- Specialized Cancer Care Support with oncology-focused expert recommendations, treatment reminders, and query insights.
- Data Security & Compliance with encryption, audit logs, and role-based access controls.
- Scalability & Future Readiness through modular design, real-time updates, caching, and AI extensions.
The Solution
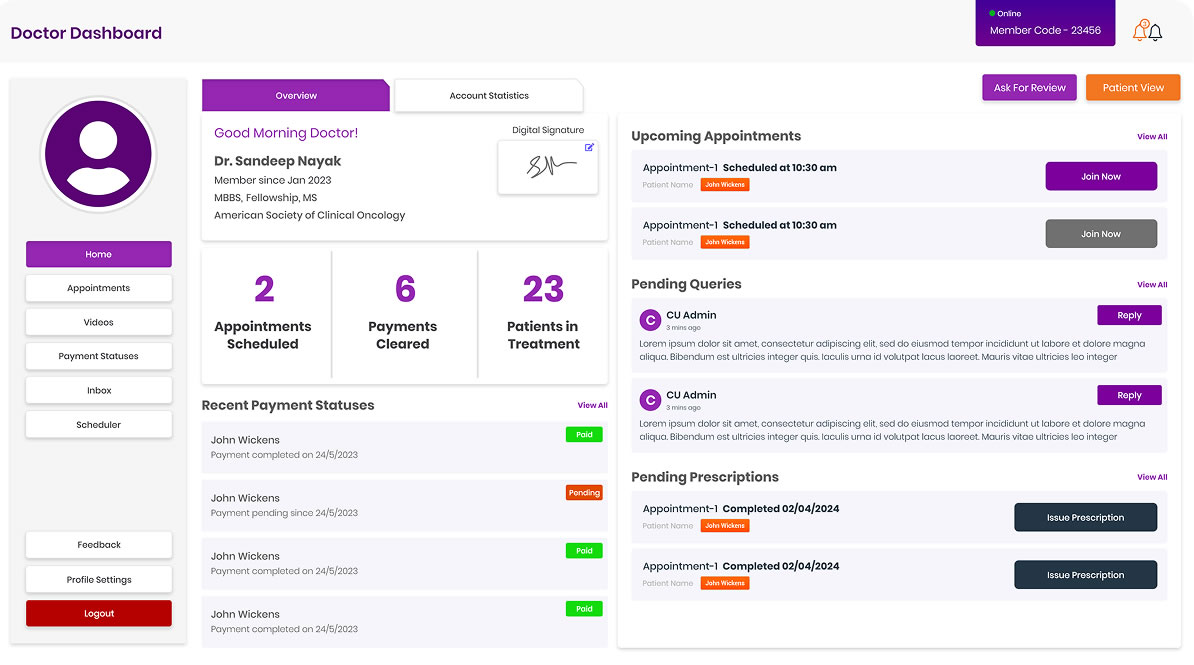
Adminstration & Oversight
- Unified dashboard displaying KPIs such as active users, expert availability, appointments, and revenues.
- Real-time monitoring of registrations, bookings, cancellations, and user activity.
- Drill-down analytics into patient queries (including cancer-specific concerns), consultation outcomes, and expert performance.
- Configurable reports for compliance audits, revenue reconciliation, and trend analysis.
Patient Engagement
- Conversational AI delivering empathetic, real-time responses, backed by expert validation.
- Repository of queries used to build FAQs and identify health trends.
- Escalation mechanism for complex or sensitive queries (e.g., oncology-related) to connect patients directly with specialists.
- Multi-language support for inclusivity and accessibility.
Expert Tools
- Enterprise-grade scheduling engine with recurrence rules, conflict prevention, and timezone accuracy.
- Status-aware booking workflows (Available, Booked, Pending, Cancelled, Rescheduled).
- Integrated video consultations with secure join tokens, lobbies, chat, screen sharing, recording, and host controls.
- Automated notifications and reminders for both experts and patients.
- Oncology-specific workflows for follow-ups, therapy sessions, and multidisciplinary team meetings.
Security & Compliance
- Role-Based Access Control across patients, experts, and admins.
- Consent verification before consultations, especially critical for cancer treatment.
- Encrypted data storage, scoped tokens, audit logs, and PII minimization.
- Protection mechanisms such as CSRF prevention, rate limiting, and timezone normalization.
Data & Insights
- Revenue analytics with monthly and yearly comparisons.
- Query aggregation to identify common health concerns and oncology-specific needs.
- Predictive analytics for patient demand, expert allocation, and cancer care resource planning.
- Anomaly detection for unusual activity patterns, cancellations, or treatment interruptions.
- AI-driven admin assistant for generating reports, surfacing insights, and suggesting actions.
Business Impact
- Empowered Patients: 24/7 access to general and cancer-specific healthcare guidance reduced unnecessary visits and improved confidence in care.
- Specialized Cancer Support: Patients gained priority access to oncologists, reliable information on treatment and side effects, and streamlined follow-ups.
- Optimized Expert Workflows: Scheduling automation, reminders, and repetitive query handling freed up specialists to focus on critical cases.
- Transparent Operations: Real-time dashboards and compliance-ready reports improved oversight and accountability.
• Operational Efficiency: Reduced manual interventions and improved coordination between patients, experts, and administrators. - Future-Ready Growth: Scalable and modular architecture positioned the platform for predictive analytics, AI-driven automation, and integration with cancer research databases.
- Trust & Security: Strong compliance measures and audit trails reinforced confidence among patients, experts, and regulators.
Technology Used
- Frontend: React, Next.js, Bootstrap for responsive and accessible UI.
- Backend: Python with Django (DRF framework, microservices as needed).
- Database: MySQL (for structured data).
- Authentication & Security: NextAuth, JWT, OAuth2, Role-Based Access Control, encryption libraries.
- Video Consultations: Zoom SDK, WebRTC, Socket.IO for real-time communication.
- AI/ML Integration: OpenAI API, additional NLP models (for video transcription & analysis), Python packages for model integration.
- Analytics & Reporting: Custom dashboards with Chart.js/Recharts.
- Infrastructure & Scalability: AWS EC2, AWS S3.
- Notifications & Scheduling: Cron jobs, AWS SNS (SMS), ZeptoMail (Email).
- Developing a Unified Sales Tracking Dashboard for a Leading Radio Station
Industry
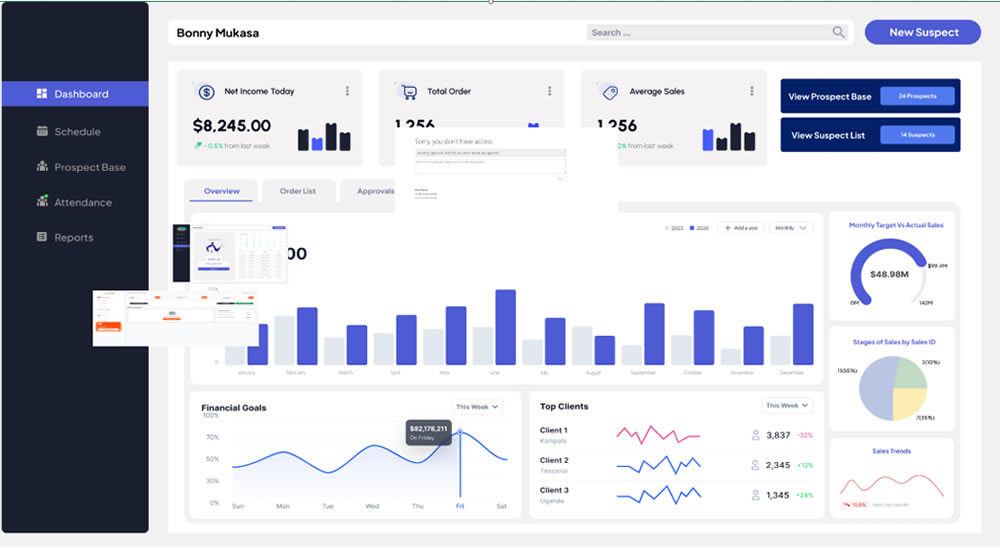
Our team developed a sophisticated, multi-level sales tracking dashboard for a major player in the broadcast media industry. The goal was to centralize sales data, streamline operations, and provide role-specific insights across their entire sales hierarchy, from individual representatives to executive management.
The Challenge
The client’s sales organization operated with multiple channels, each managed by a dedicated sales manager and a team of salespeople. The primary challenge was a lack of a unified system to track sales performance, employee activities, and revenue generation across different levels of the hierarchy.
Key issues included:
- Fragmented Data: There was no central platform for viewing consolidated sales data, making it difficult for the Head of Sales to get a holistic view of the entire operation.
- Inefficient Management: Sales managers lacked the tools to effectively monitor their team’s performance, track lead pipelines, manage schedules, and ensure productivity in the field.
- Limited Salesperson Tools: Sales representatives needed a dedicated portal to manage their leads, log sales activities, track their progress against targets, and schedule client meetings efficiently.
Scope of the Project
The project’s objective was to design and implement a comprehensive sales dashboard with distinct functionalities tailored to three user roles: Salesperson, Manager, and Head of Sales.
The scope included developing three interconnected dashboards:
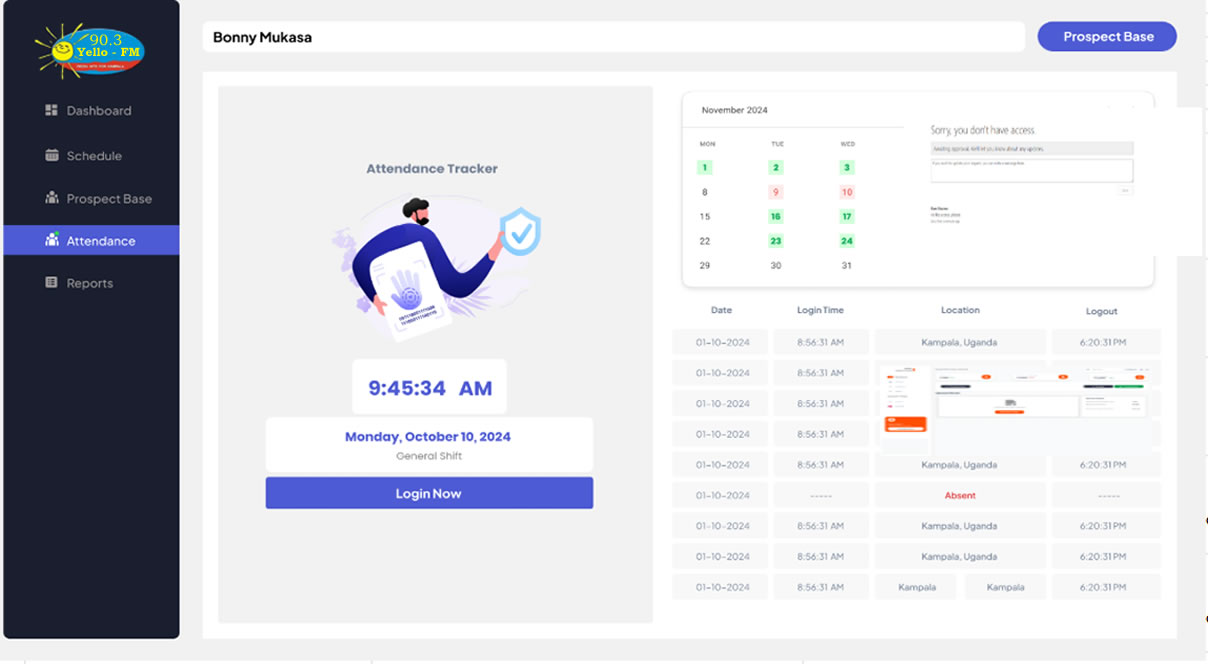
- Salesperson Portal: A personalized dashboard for individual sales reps to manage their leads through every stage of the sales pipeline, view performance KPIs, access a scheduler for client meetings, and log daily attendance.
- Manager Dashboard: A consolidated view for sales managers to track their team’s overall performance, monitor aggregated KPIs, forecast revenue based on the team’s pipeline, and manage schedules. It also included features for tracking team member attendance and field activities.
- Head of Sales Dashboard: A high-level executive dashboard providing a complete overview of all sales channels and managers. This view allows senior management to monitor company-wide performance, compare channel results, and make strategic, data-driven decisions.
The Solution
- Empowering Sales Representatives: The individual salesperson portal acts as a daily command center. It features lead and opportunity management, automated reminders for follow-ups, and clear visualizations of performance against targets, boosting personal accountability and efficiency.
- Enabling Proactive Management: Managers can now access a unified dashboard to see their team’s consolidated sales pipeline, track real-time activity, and view attendance logs. The system allows them to balance workloads by reassigning leads and approve deals directly within the platform, enhancing team productivity and agility.
- Providing Strategic Oversight: For the Head of Sales and top executives, the dashboard offers a powerful analytics tool. With drill-down capabilities, they can move from a high-level overview to the performance details of a specific channel, manager, or even an individual salesperson, ensuring complete visibility and control.
Business Impact
- Increased Sales Efficiency: By automating task management and providing a clear view of leads, sales reps can focus more on selling and less on administrative tasks, leading to shorter sales cycles and higher close rates.
- Improved Revenue Predictability: With a consolidated pipeline and historical data analysis, managers and executives can generate more accurate revenue forecasts, enabling better financial planning and resource allocation.
- Enhanced Managerial Effectiveness: Managers gained the ability to monitor team performance in real time, identify top and bottom performers, and provide targeted coaching. The ability to manage schedules and reassign leads ensures continuous productivity.
- Data-Driven Strategic Decisions: Executive leadership can now make informed decisions based on comprehensive, real-time data on channel performance and market trends, rather than relying on disparate reports.
- Greater Accountability and Motivation: Personalized KPIs and transparent performance tracking have fostered a culture of accountability, motivating sales reps to meet and exceed their targets.
Technology Used
- Library Management System Case Study
The Challenge
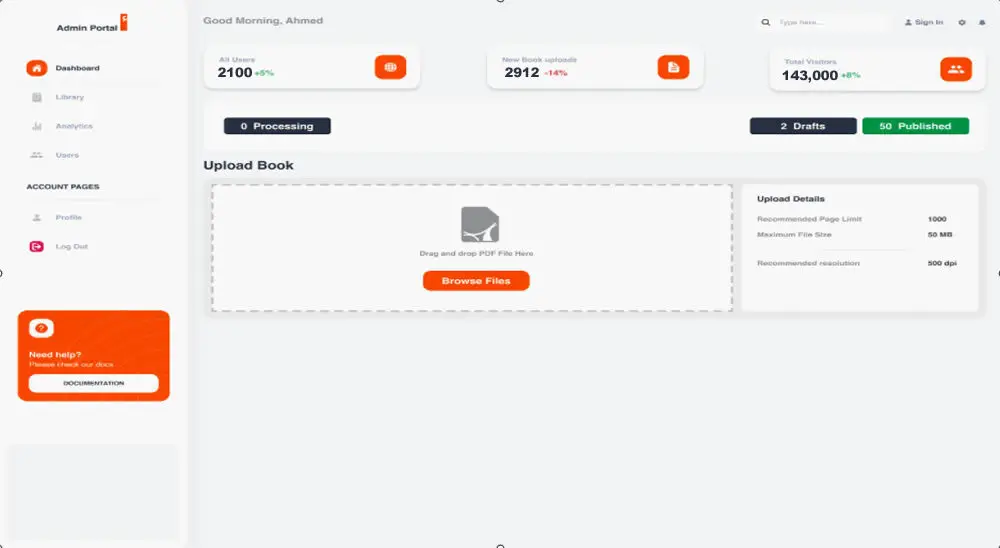
The client required a modern, centralized platform to manage digital books—including uploading PDFs, converting them into readable text, generating audiobooks, and providing seamless access for users to save, read, or listen later. The main challenge was to simplify a multi-step workflow (upload → convert → save → access) into a clean, intuitive, and scalable interface.
Scope of the Project
– Enable PDF uploads with support for large files and multiple formats.
– Provide automatic conversion of PDF files into text and audio (text-to-speech).
– Create modules to save, organize, and categorize books.
– Enable users to listen to audiobooks directly from the platform.
– Provide analytics on uploads, user activity, and library growth.
The Solution
– Summary cards showing Total Users, Total Books Uploaded, and Total Visitors.
– Indicators for percentage changes (+/-%) in uploads and user engagement.
Book Upload & Conversion
– Drag & drop upload area with support for PDF files.
– Upload details panel showing recommended limits (page size, file size, resolution).
– Automatic PDF → Text → Audio conversion pipeline.
Library & Book Management
– Dedicated Library section to view, search, and filter uploaded books.– Save and categorize books by genre, author, or user-defined tags.– Status indicators for uploaded books (Processing, Draft, Published).
Audiobook Features
– In-browser audio player for listening to converted books.– Ability to pause, bookmark, and resume playback.– Download option for offline listening.
Analytics & Insights
– Charts and metrics to show most-read books, top listeners, and upload trends.– Activity breakdown by users and regions. Navigation & Workflow Enhancements
– Sidebar navigation for Dashboard, Library, Analytics, Users, and Profile.– Help & Support section for quick documentation access.– Search bar for finding books or users instantly.
Business Impact
Technology Used
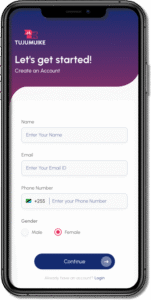
- Event Management System – User, Host & Admin Platform


The Challenge
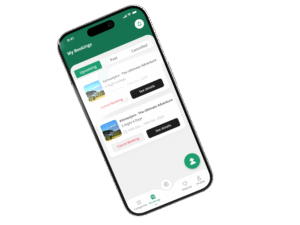
The client required a complete event management ecosystem with three integrated modules: a user-facing mobile app, a host-facing mobile app, and an admin web application. The challenge was to streamline the end-to-end event lifecycle—from ticket booking and payments to on-ground QR code validation and revenue tracking—while ensuring real-time updates, secure payments, and a smooth user experience.
Scope
- User Mobile App:
- Registration, login, and access to personalized dashboards.
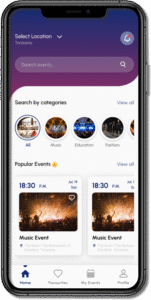
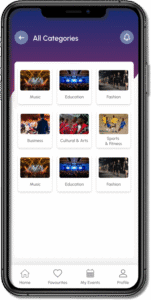
- Explore upcoming events, apply filters, view event details, and add to wishlist.
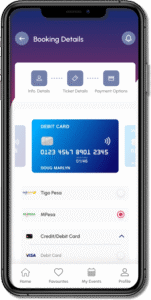
- Book event tickets for self and family members via Razorpay.
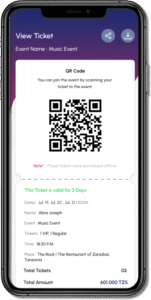
- Share billing details and QR codes for entry validation.
- Receive push notifications for booking confirmations and updates.
- Host Mobile App (Scanner App):
- Event organizers can scan user QR codes for entry validation.
- Real-time check-in tracking with per-head calculations.
- Send instant push notifications to users regarding ticket validation.
- Admin Web Application:
- Manage events, users, and hosts from a centralized panel.
- Track ticket sales, bookings, and revenue.
- Access real-time analytics with statistics and graphical reports.
- Monitor event performance and ensure security compliance.
Solution
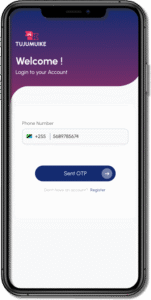
- Registration & Login with secure authentication.
- Event Browsing with search, filters, and detailed event descriptions.
- Ticket Booking & Payments via Razorpay with multi-member booking support.
- QR Code Generation for each booking, sharable with family members.
- Booking History & Wishlist for easy tracking of past and upcoming events.
- Notifications for booking confirmations, reminders, and updates.
- QR Code Scanner for validating user entry.
- Real-time Validation with per-head attendance tracking.
- Instant Notifications sent to users upon validation.
- Event Management Tools for quick on-ground coordination.
- Event Creation & Management: Add, update, or remove events.
- Revenue & Ticket Insights: Track bookings, revenue, and refunds.
- Analytics & Reports: Visual statistics with graphs for performance monitoring.
- User & Host Management: Verify hosts, monitor users, and manage access rights.
Business Impact
- Enhanced User Experience: Simplified booking and family-inclusive ticketing increased participation.
- Secure Event Entry: QR-based validation minimized fraud and ensured smooth entry.
- Revenue Transparency: Admin dashboard improved financial tracking and decision-making.
- Operational Efficiency: Real-time scanning and notifications streamlined event check-ins.
- Scalability: Future-ready system to support large-scale events across multiple regions.
Technology Environment
- React Native – Mobile applications for users and hosts.
- React.js – Admin web dashboard for event and revenue management.
- Django Rest Framework (DRF) – Backend APIs with business logic.
- MySQL – Database for users, events, bookings, and transactions.
- Razorpay – Secure payment gateway integration.
- Push Notifications (Firebase) – Real-time booking confirmations and validation alerts.
- QR Code System – Secure entry validation and per-head attendance tracking.
- Travel Safari
Industry
Our team developed a sophisticated, multi-level sales tracking dashboard for a major player in the broadcast media industry. The goal was to centralize sales data, streamline operations, and provide role-specific insights across their entire sales hierarchy, from individual representatives to executive management.
The Challenge
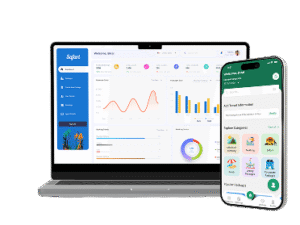
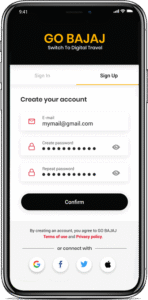
the client wanted to build a competitive, modern alternative that could simplify the fragmented travel booking experience. The vision was to create a centralized ecosystem where everything—package creation, agent management, customer bookings, payments, and revenue tracking could be managed seamlessly. The challenge was not just technical but also experiential: how to consolidate multi-role workflows and heavy data operations into a platform that felt effortless to use. The interface needed to remain simple for end-users booking trips, yet powerful enough for agents and administrators to manage complex operations. At the same time, the solution had to be future-ready, scalable for new features, and capable of delivering actionable insights to drive business growth.
Scope of the Project
The project was designed to serve two primary user groups: administrators/agents and end customers.
Admin & Superadmin Dashboard
- A unified dashboard to oversee all travel operations in real time.
- Modules for managing travel packages, agents, users, vendors, and bookings.
- Visualization tools to track booking volumes and revenue performance.
- Location-wise analytics to identify top-performing regions and optimize offerings.
- Streamlined workflows for package creation, approval, and status monitoring.
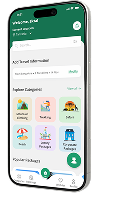
User-Facing Mobile Application
- A customer-centric mobile app for seamless travel booking.
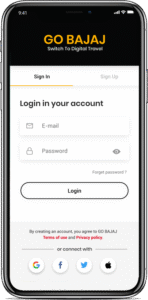
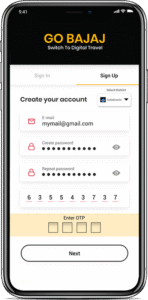
- Secure login and profile setup for personalized experiences.
- Simple, guided workflows for browsing and booking packages.
- Integrated payment flow to confirm bookings instantly.
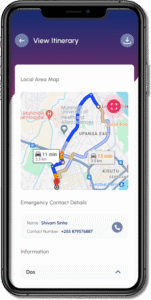
- Travel-ready features to support customers before and during their journey.
The Solution
Dashboard Overview Panels We created top-level summary cards highlighting key metrics such as Total Bookings, Users, Agents, Vendors, and Revenue. Each card included color-coded performance indicators (+/–%) to give admins quick week-over-week insights at a glance.
Revenue & Package Performance Graphs
For deeper visibility, revenue trends were represented using line charts, while package sales were shown as bar charts segmented by travel types (e.g., Mountain Climbing, Safari). Admins could switch between “This Week” and “Last Week” to compare performance instantly.
Real-Time Booking Tracker
A real-time booking visualization was introduced using pie charts to display booking statuses (Completed, Confirmed, Cancelled). Horizontal bar charts further broke down booking trends by package, providing actionable insights on customer preferences.
Recent Bookings Table
A detailed bookings table included Booking ID, Package Name, Status, Number of Persons, Total Spent, and Date Range. Status tags (Pending, Confirmed, Cancelled) were paired with visual markers for clarity and faster decision-making.
Geo Insights Panel
To help identify demand hotspots, we integrated an interactive world map showing the most-booked countries. Country-wise booking data was displayed with proportional bars, allowing admins to track regional performance effortlessly.
Navigation & Workflow Enhancements
The overall workflow was made more intuitive with sidebar navigation grouped by tasks such as Package Creation, Agent Details, User Details, and Bookings. Pagination was added to handle large datasets efficiently, and a global search bar with a country selector was introduced for quick filtering and faster navigation.
Business Impact
The Travel Safari platform transformed the way travel operations were managed by consolidating fragmented workflows into a unified ecosystem. The streamlined dashboards and real-time analytics empowered administrators to make faster, data-driven decisions, while the mobile application offered customers a seamless, modern booking journey.
Key business outcomes included:
- Operational Efficiency – Centralized dashboards reduced manual overhead for agents and admins, cutting down time spent on managing packages, users, and bookings.
- Improved Decision-Making – Visual insights on revenue trends, regional demand, and booking performance enabled data-backed strategic planning.
- Enhanced User Experience – The mobile app delivered a simple, guided booking flow, leading to higher customer satisfaction and improved trust.
- Scalability for Growth – A future-ready architecture allowed the platform to accommodate new travel categories, partners, and analytics features as business needs evolve.
- Competitive Edge – By combining intuitive design with robust operations, the platform positioned the client to compete with larger players like MakeMyTrip while focusing on niche experiences and tailored offerings.
Technology Used
- Figma, Adobe XD for Mockups, Prototype, And Handoff
- Nextjs
- Auto Booking & Travel Management App

The Challenge
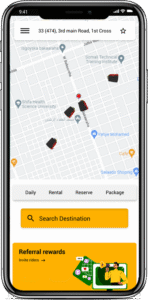
The client needed a reliable and user-friendly mobile platform for connecting passengers with auto driver similar to Ola or Uber but tailored for local auto-rickshaw transportation. The challenge was to create a seamless booking experience, real-time ride tracking, and efficient communication between users, drivers, and the admin, while ensuring security through OTP verification and feedback mechanisms.
Scope of Project
- Develop a mobile app for Users to register, book rides, view history, and provide feedback.
- Create a mobile app for Drivers to accept bookings, receive notifications, and manage rides.
- Build an Admin Dashboard to manage users, drivers, ride history, and overall system monitoring.
- Enable real-time booking and tracking from the current or custom location to the destination.
- Provide ride history, reviews, and rating system for transparency and accountability.
The Solution
User App Features
- Registration & Login: Secure onboarding via email/phone.
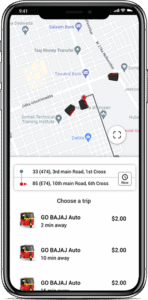
- Booking Module: Book autos from current GPS location or a chosen location.
- Ride Tracking: Live status of driver acceptance, arrival, and trip progress.
- OTP Verification: Secure ride start validation using OTP.
- Ride History & Feedback: View past rides, give ratings, and submit reviews.
Driver App Features
- Driver Registration & Verification for onboarding.
- Real-time Notifications for new bookings.
- Ride Management: Accept or decline rides, track ongoing rides.
- Earnings & History: Access completed ride details and total earnings.
Admin Dashboard Features
- User & Driver Management: Monitor and verify registrations.
- Ride Tracking: Access real-time data of ongoing and completed trips.
- Booking & Payment Records: Manage ride history, cancellations, and payments.
- Feedback & Reviews: Track user ratings and driver performance.
Business Impact
- Improved Accessibility: Simplified auto booking process increased customer convenience.
- Driver Empowerment: Drivers received fair opportunities with transparent booking and earnings.
- Operational Efficiency: Centralized admin dashboard reduced manual intervention.
- Enhanced Trust & Security: OTP verification and reviews-built confidence among users.
- Scalability: The platform can expand to support multiple cities and advanced payment systems.
Technology USED
- React Native – Cross-platform mobile application development.
- React.js (Admin Panel) –Scalable and interactive dashboard interface.
- Django Rest Framework – Secure and efficient backend with APIs.
- MySQL – Robust relational database for storing users, drivers, and ride data.
- Google Maps API – Real-time location tracking and navigation.
- Firebase Notifications – Instant ride alerts and updates.
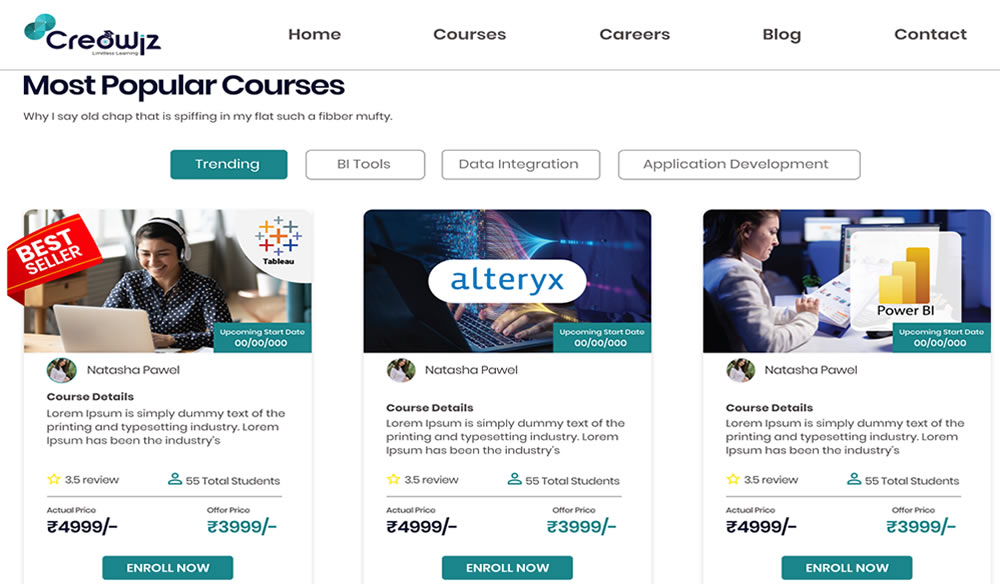
- E-Learning Platform – Online Learning & Student Management
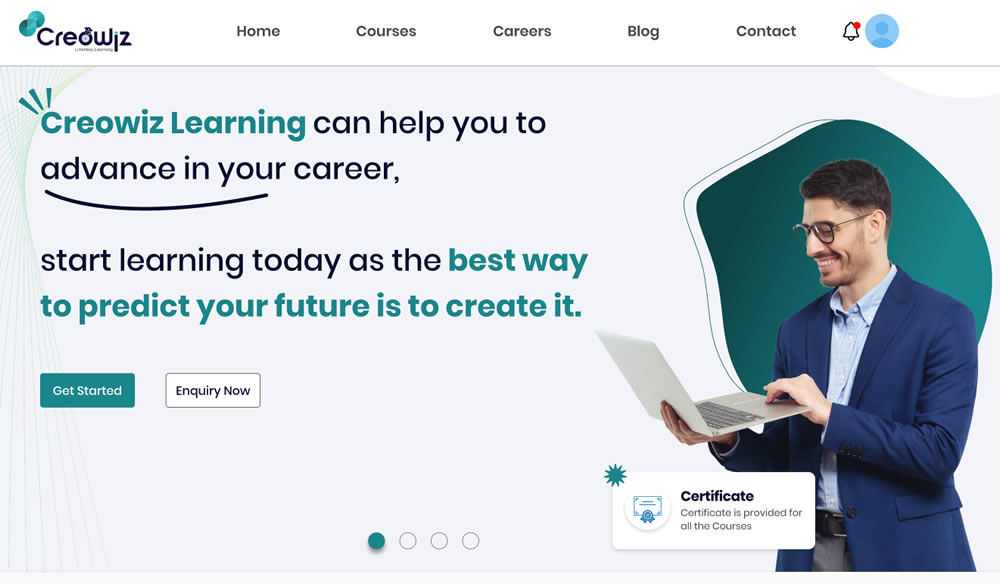
The Challenge
The Solution
- Build a React.js student portal for registration, login, and course access.
- Develop an Admin Dashboard to upload video content, create quizzes, and manage students.
- Integrate Classplus platform for live one-on-one teacher-student interactions.
- Provide a secure payment gateway (Razorpay) for course enrollment.
- Track student progress, weekly tests, and quiz results in real time.
- Ensure scalability and seamless learning experience with video and interactive content.
The Solution
- Registration & Login: Secure student onboarding with profile management.
- Course Dashboard: Access to enrolled courses, video lessons, and quizzes.
- Payment Integration: Razorpay gateway for smooth and secure transactions.
- Classplus Integration: Direct link to live one-on-one teacher sessions.
- Progress Tracking: View test results, weekly performance, and learning milestones.
Admin Dashboard Features
- Content Management: Upload course videos, documents, and materials.
- Quiz Builder: Create quizzes with automatic evaluation and reporting.
- Student Management: Monitor registrations, payments, and course progress.
- Performance Reports: Weekly test results and student analytics for intervention.
- Classplus Integration: Sync content and sessions with Classplus platform.
Business Impact
- Increased Engagement: One-on-one learning via Classplus improved teacher-student interaction.
- Revenue Growth: Razorpay integration enabled seamless payments, boosting enrollments.
- Progress Visibility: Weekly test reports allowed teachers to intervene early.
- Efficient Content Delivery: Admins could easily upload and manage courses and quizzes.
- Future-Ready: Scalable platform to accommodate more students, courses, and features.
All the reasons to choose BIITS.
B-Informative IT Services Pvt. Ltd. (BIITS) is an award-winning Business Intelligence & Digital & Consulting company based out of Indian Silicon Valley, Bangalore. We are a team of motivated professionals with expertise in different domains and industries. We help our clients to derive simplified and conclusive data insights for effective decision making.