The Challenge
The client required a modern, centralized platform to manage the entire travel ecosystem—including package creation, agent management, user tracking, booking monitoring, and revenue insights. The challenge was to simplify a multi-role, data-intensive workflow into an interface that remained clean, informative, and scalable for future features.
Scope Of Project
- Design a unified dashboard for Admins and Super Admins to monitor all travel operations.
- Provide modules to manage packages, agents, users, vendors, and bookings.
- Visualize booking and revenue performance trends.
- Integrate location-wise analytics to determine top-performing regions.
- Enable intuitive workflows for package creation and status monitoring.
The Solution
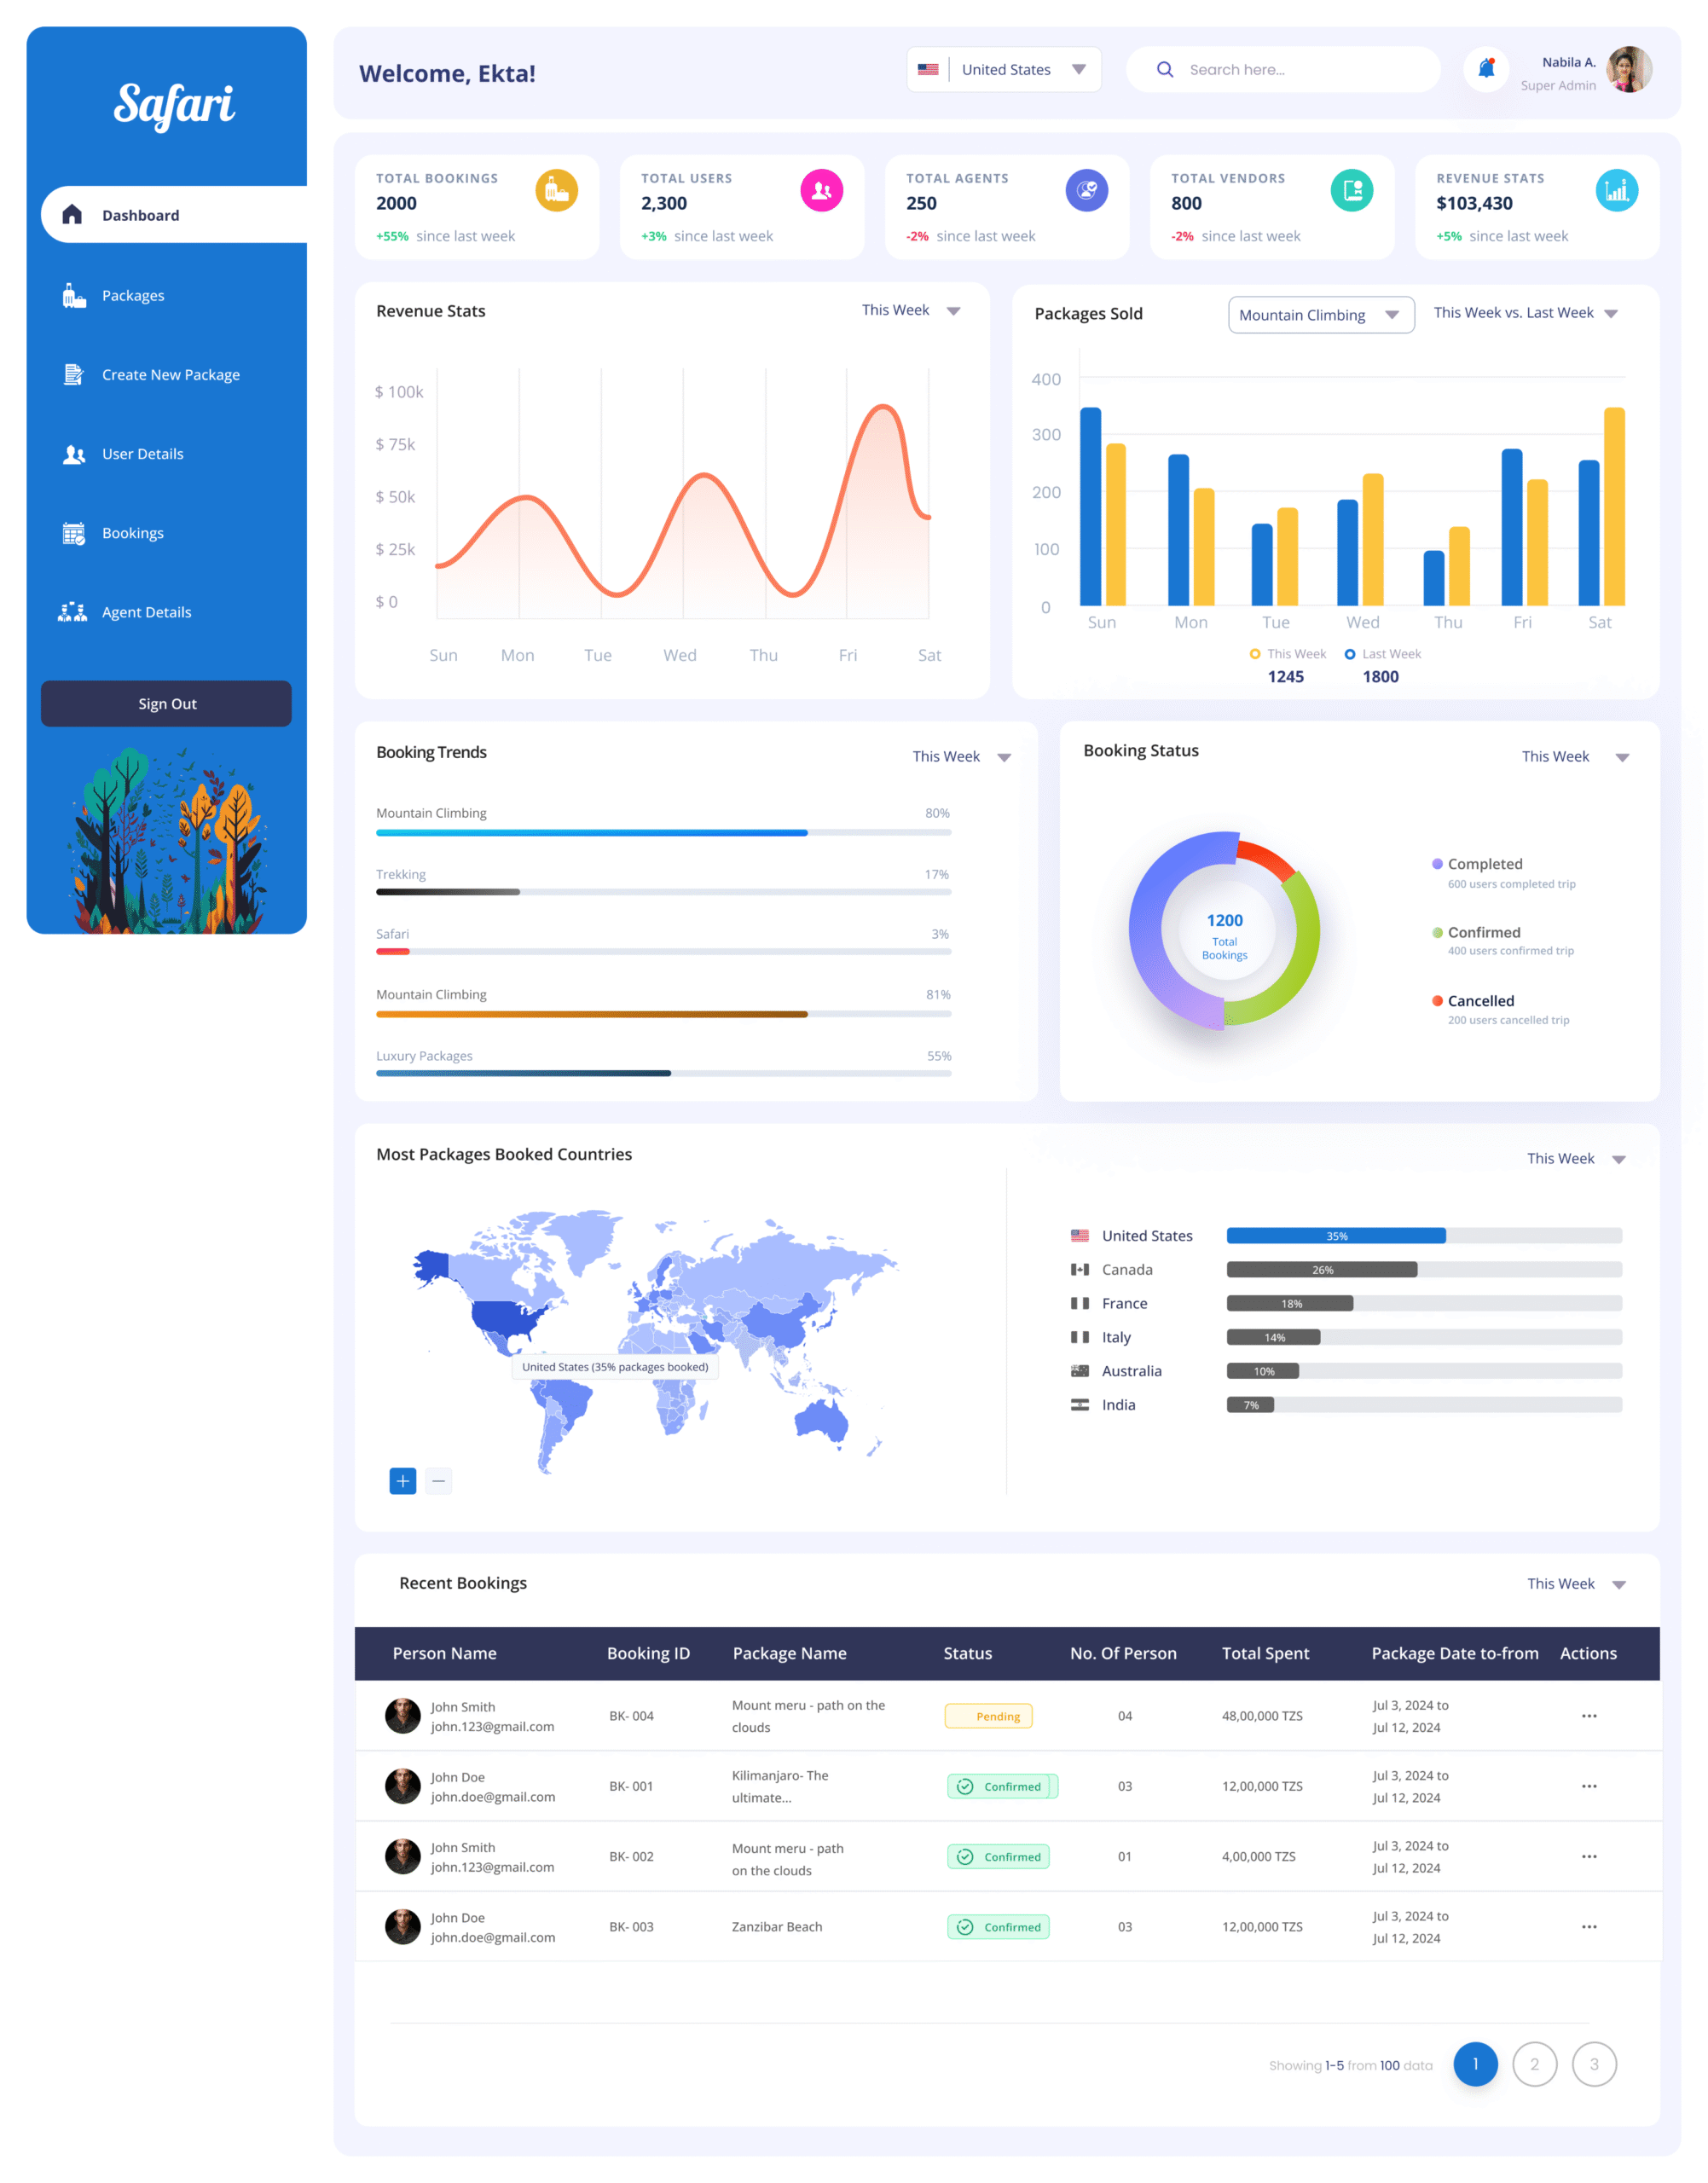
- Dashboard Overview Panels
- Designed top summary cards showing Total Bookings, Users, Agents, Vendors, and Revenue.
- Used color-coded indicators (+/-%) for week-over-week performance.
- Revenue & Package Performance Graphs.
- Implemented line charts for revenue stats and bar charts for packages sold—segmented by travel types (e.g., Mountain Climbing, Safari).
- Enabled toggle between “This Week” and “Last Week” comparisons.
- Real-Time Booking Tracker
- Used pie charts to visualize booking status (Completed, Confirmed, Cancelled).
- Booking trends displayed using horizontal bars for percentage breakdowns by package.
- Recent Bookings Table
- Included columns for Booking ID, Package Name, Status, Persons, Total Spent, Date Range.
- Status tags (e.g., Pending, Confirmed) with visual indicators.
- Geo Insights Panel
- World map integration to visualize most booked countries.
- Country-wise booking data displayed with proportional bars.
- Navigation & Workflow Enhancements
- Sidebar navigation grouped by tasks: Create Package, Agent Details, User Details, Bookings.
- Added pagination in tables for handling large datasets efficiently.
- Search bar and country selector for quick filtering.
The Impact on Business
- Faster Decision-Making
- Real-time dashboards give management instant visibility into bookings, revenue, and performance trends, enabling quick and data-driven decisions.
- Improved Sales & Revenue Tracking
- Revenue graphs and package performance insights help identify high-performing packages and underperforming ones, guiding targeted promotions and pricing adjustments.
- Enhanced Customer Experience
- Real-time booking tracking ensures faster issue resolution for pending/cancelled bookings, improving customer satisfaction and trust.
- Optimized Operations
- Geo insights reveal top-performing regions, helping the business allocate resources, marketing budgets, and vendor partnerships more effectively.
- Better Agent & Vendor Management
- Centralized data on agents, vendors, and bookings ensures transparency and accountability, reducing operational inefficiencies.
Technology Used
- Figma, Adobe XD for mockups, prototypes, and handoff
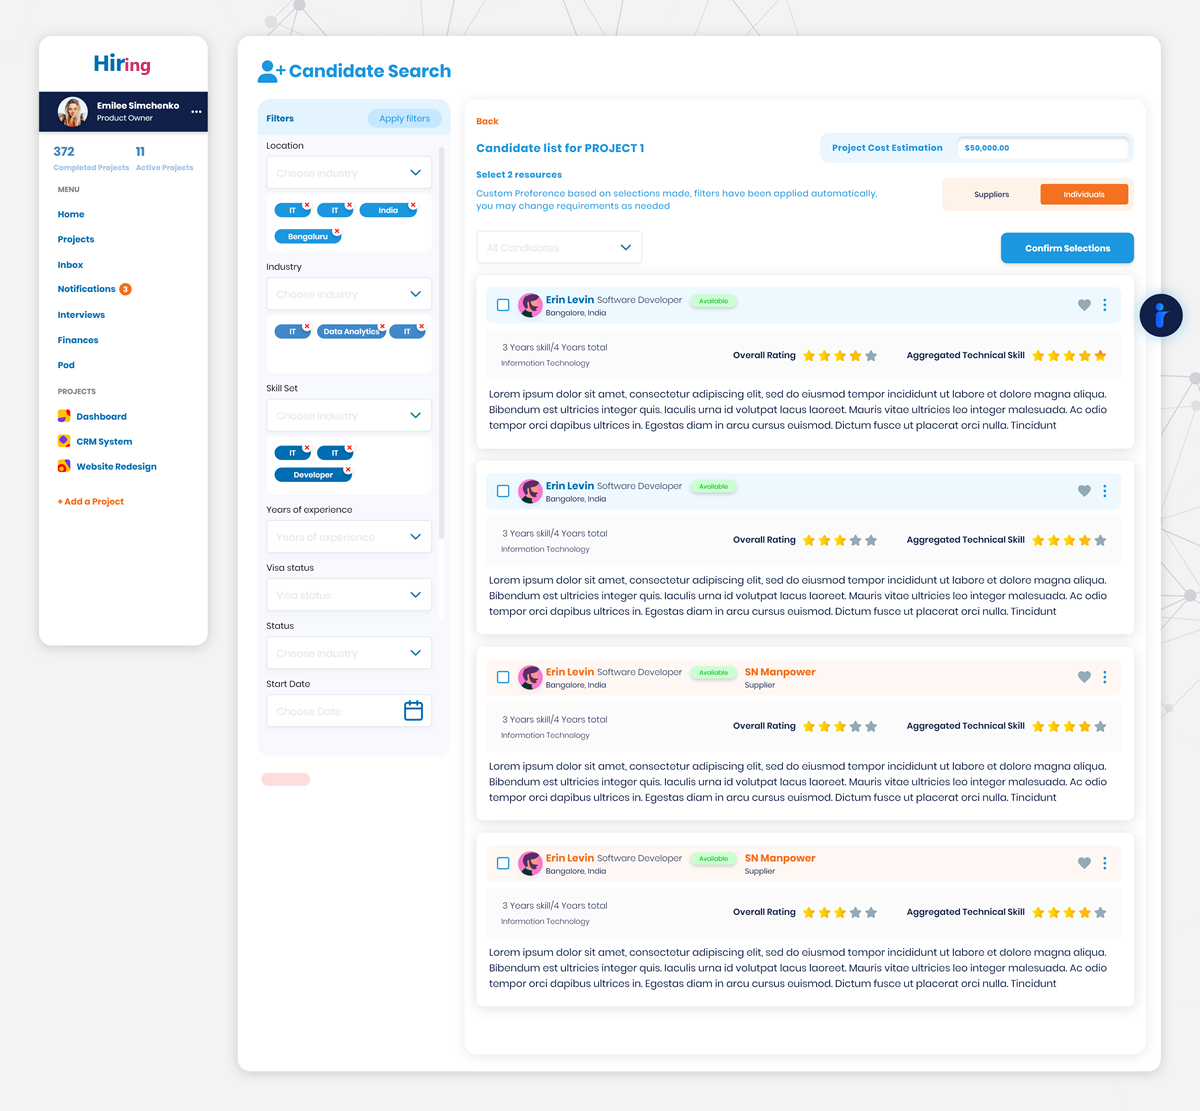
The Challenge
- Clients and candidates were doing a lot of things in different places—creating projects, searching and shortlisting people, scheduling interviews, onboarding, sharing files, reviewing work, and handling payouts—without one clear path from start to finish. Money terms were easy to mix up (project balance, add funds, payment method), interviews could be missed without a friendly scheduler, and the “what happens after the call?” step wasn’t obvious. Candidates also struggled to show a complete profile, keep track of interviews and tasks, and understand payouts and withdrawals, which hurt confidence on both sides.
Scope Of Project
- Access & Home: Sign up / sign in, welcoming landing, and a clear dashboard for each role.
- Projects: Create and edit projects, revise dates, add team members, and see an organized list of projects.
- Talent & Evaluation: Search individuals or suppliers, open full profiles, and keep interview lists handy.
- Interviews: Friendly scheduling with a clear notice, start the call, and move to the next step confidently.
- Onboarding → Active Work: Guided onboarding after interviews; track an active project, see each resource, and review work.
- Money: Add funds, save a payment method, view balances, see payout status, add a bank account, withdraw, and view history.
- Collaboration & Notices: Inbox and Pod spaces for conversations, plus notifications in one place
The Solution
- We connected the whole journey end-to-end: clients create a project, shortlist people (individuals or suppliers), schedule interviews with a clear notice, start the call, and then onboard the chosen person right away.
- We created an Active Project hub that shows each resource and their work in one place, so clients can review and move forward without hunting through screens.
- We simplified money into one clear flow: Add Funds, see Project Balance, and Add Payment Method now work together like a single wallet for the project.
- We made payouts predictable: clients see payout status in Finances, while candidates can add/manage bank accounts and withdraw balance with a visible history.
- We strengthened candidate profiles with photo, skills, experience, and a short video—plus an easy way to ask for reviews and display them.
- We made interviews smoother for candidates: a clear list of upcoming calls, one-click join, a prep space for files/work, and a completed state after the call.
- We streamlined delivery: candidates log timesheets and tasks, and clients see those items alongside the active project for quick review and approval.
- We kept conversations tidy with Inbox (messages), Pod (project space), and a single Notifications area.
The Impact on Business
Clients and candidates can now move from first contact to completed work without second-guessing the steps. Interviews happen on time, onboarding starts right after decisions, and work is reviewed in one clear place. When work is approved, payment follows smoothly—less confusion, fewer disputes, faster hires, and more trust on both sides—so good matches stay active and projects finish on schedule.
Technology USED
- Figma, Adobe XD for mockups, prototypes, and handoff
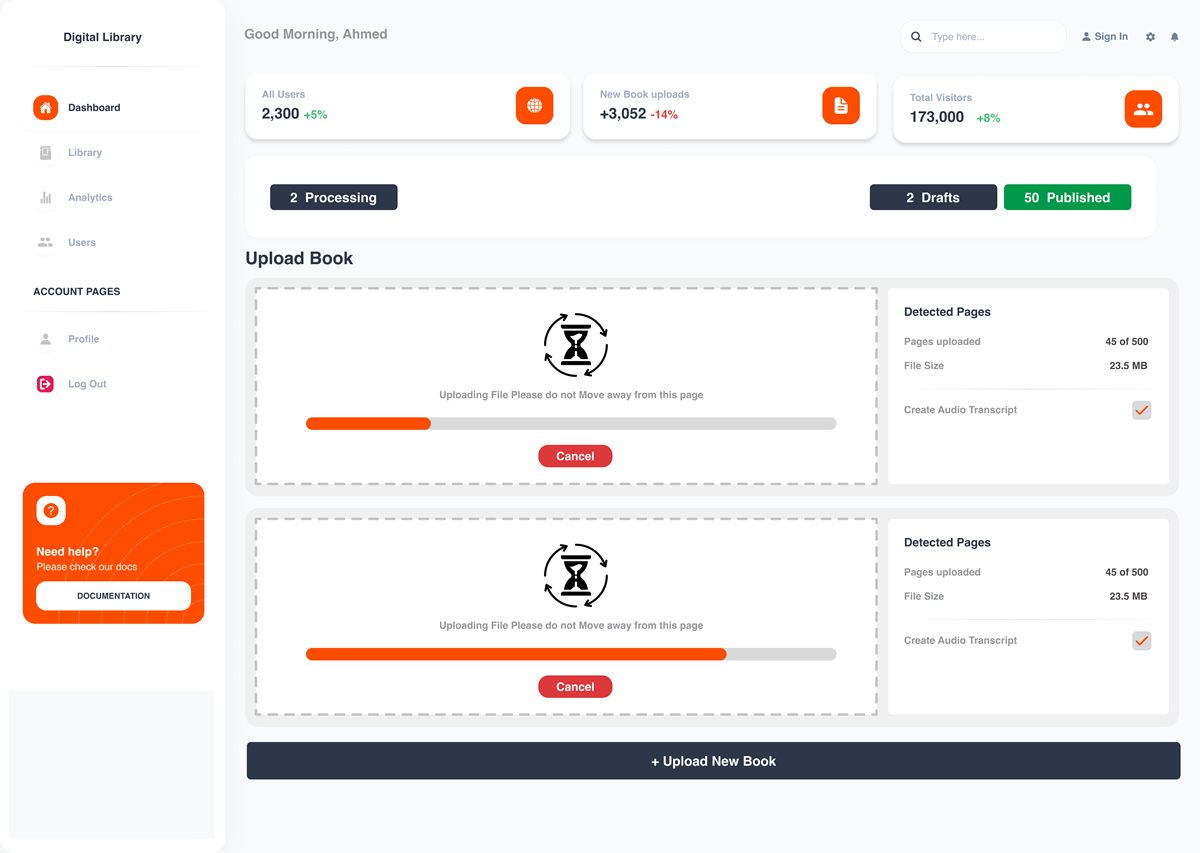
The Challenge
Most books existed only as scanned PDFs, which meant readers couldn’t search within them or use assistive tools easily. Audio versions were missing or scattered, and people had to jump between different apps to read or listen. On the admin side, uploading a book, adding details, tracking transcription progress, and publishing updates took too many steps—with no simple way to review what’s live or fix mistakes quickly. Together, this slowed access for readers and created extra work for staff.
Scope Of Project
- Admins sign in and land on a clear home screen with a simple starting point
- Admins add book details and run a guided upload that creates clean text and audio versions
- Admins review the results and publish without switching tools
Readers discover books and save favourites in My Library - Each title opens to a focused book page with one click to read the text or listen to the audio
- The product covers the full journey from uploading a book to enjoying it in text or audio in one web app
The Solution
- End-to-end admin workflow: From Admin Sign Up/Sign In to Upload Book Details and a guided Upload/Process sequence that produces both text and audio, with clear screens for review and publishing.
- Reader-first experience: A simple Homepage for discovery, My Library to collect favourites, and a focused book view with two clear modes—Read (PDF-to-text) and Listen (audio)—so users can switch based on preference.
- Accessibility by default: Searchable text replaces image-only pages; audio transcripts open the catalogue to people who prefer listening or use assistive tech.
- Operational clarity: Admin homepage snapshots help staff see what’s in draft, in processing, or published, reducing back-and-forth and manual checks.
The Impact on Business
Publishing is faster, and more books are usable to more people. Readers can quickly find a title, save it, and choose to read or listen in one place—improving completion and return visits. Staff spend less time wrestling with files and more time curating the catalogue, because transcription, review, and publishing now live in a single, clear flow. Overall, access improves, support requests drop, and the library’s collection has a longer, more accessible life.
Technology used
- Figma, Adobe XD for mockups, prototypes, and handoff
The Challenge
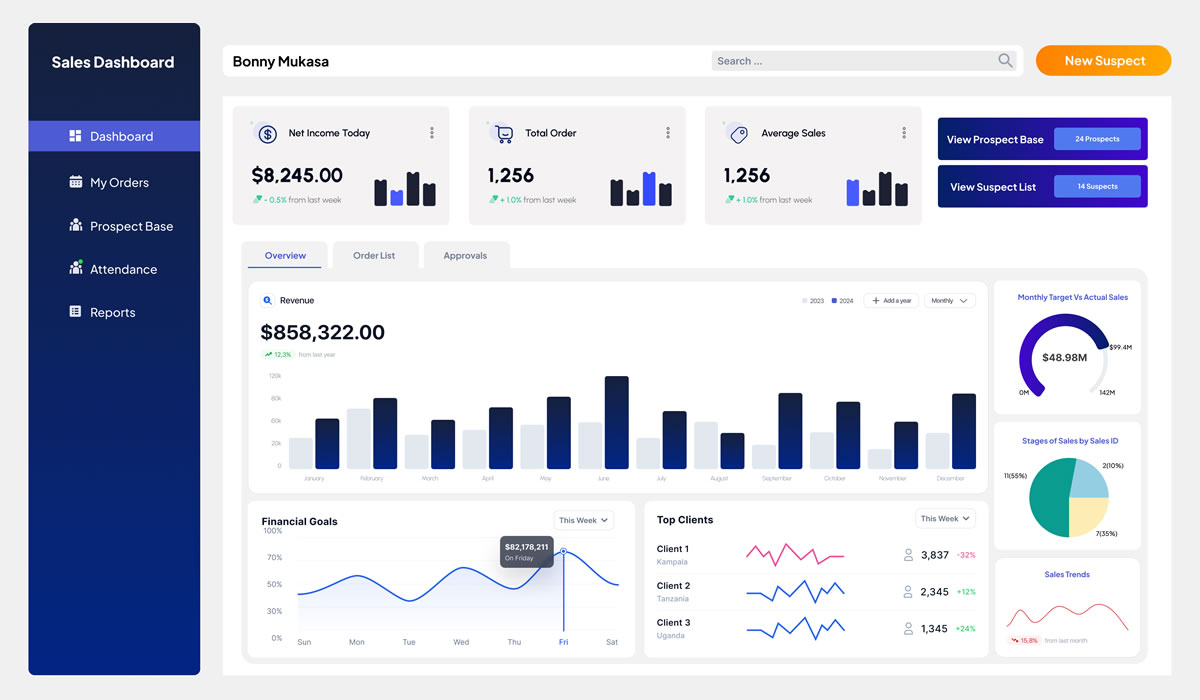
Sales teams were juggling leads, pitches, bookings, and approvals across spreadsheets and inboxes. Time Order Forms were retyped more than once, schedules clashed, and managers could not see a clean funnel from suspect to close. Forecasts were guesswork, targets were hard to track, and approvals slowed deals near the finish line. Clients also lacked a clear window into on-air performance, so post-campaign conversations relied on exported sheets instead of live analytics.
Scope Of Project
- Secure login for sales, managers, directors, and clients with role-specific home screens
- A complete sales journey that moves from suspect and prospect bases to approach, demo, and close with clear stage views and lists
- Time Order Form creation with schedule details, order lists, and conflict checks before submission
- Approvals for sales managers and directors, including quick accept or send back with remarks
- Targets, attendance, and remarks pages so reps and managers track progress without side files
- Budget planning plus performance dashboards for annual, monthly, and by-channel views
- A single client view with history, active orders, schedules, and post-campaign reviews
- Client dashboard with radio analytics so customers see results without asking for exports
The Solution
- A unified web portal that starts at login and guides each role to the next best action, from creating a lead to submitting a Time Order Form and getting it approved
- A structured pipeline that turns suspect and prospect lists into a live funnel with stage pages for approach, demo, close, and an end-of-process report
- Time Order Forms tied to the schedule, with validations that catch clashes and incomplete details before managers see the request
- A two-level approval flow for managers and directors, including quick status changes and recorded remarks for audit and coaching
- Performance views that roll up annual, monthly, and channel numbers, alongside budget planning and sales targets on one screen
- An attendance and remarks tracker so daily activity and outcomes are visible without side spreadsheets
- A client dashboard that presents radio analytics in a simple report format, reducing back-and-forth and building trust after each campaign
The Impact on Business
Deals move faster because the sales journey is clear, approvals are quicker, and schedule issues are caught early. Managers see the real funnel and can coach with facts, not guesses. Targets and budgets are tracked in the same place as orders, so forecasts improve and month-end surprises drop. Clients get a clean analytics view, which makes renewals easier and cuts time spent on manual reporting. Overall, the team closes more with fewer errors and stronger post-campaign conversations.
Technology used
- Figma, Adobe XD for mockups, prototypes, and handoff
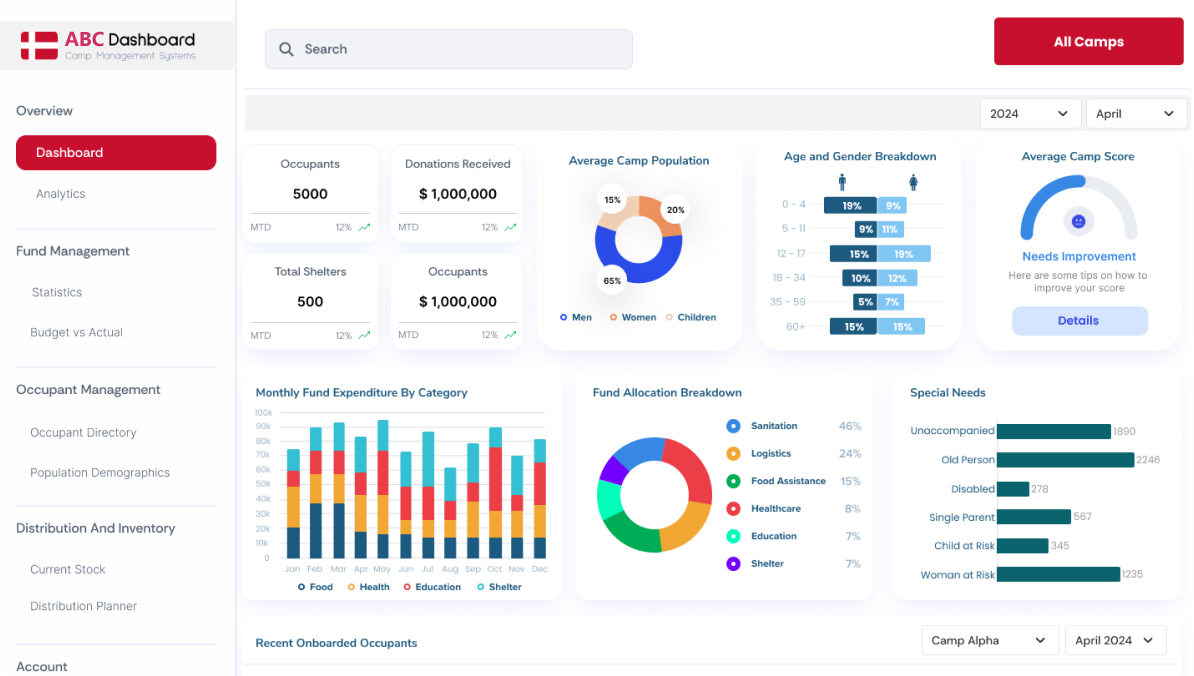
The Challenge
Camp teams were juggling paper logs and scattered spreadsheets to register people, update family details, and find the right record when help was needed. New arrivals waited while staff re-entered the same information or searched for files. Without a single place to see who lives in the camp and what has changed, services slowed and mistakes crept in. The experience needed to be simple for staff under pressure and clear for residents during stressful moments.
Scope Of Project
- A secure sign-in and sign-up flow for authorized staff
- A guided registration that captures a new occupant’s details from the first conversation
- An occupant directory that is easy to search and browse during field work
- A dashboard overview that shows the current picture of the camp at a glance
- An “add new occupant” path designed for speed at registration desks and mobile tents
The Solution
- A unified web portal with staff login and a simple start point for daily tasks
- A step-by-step register screen that reduces re-entry and helps capture clean household data
- A searchable occupant directory with quick filters so case workers can find people fast
- A dashboard overview that surfaces key counts and recent changes to support decisions on the ground
- A fast “add new occupant” action for intake teams during peak arrivals and relocations
The Impact on Business
Registration is faster, duplicates drop, and staff can find the right person in seconds. Residents spend less time waiting and get routed to the right service sooner. Coordinators see the camp picture more clearly and can plan staffing, supplies, and follow-ups with confidence. Day-to-day work feels lighter, data quality improves, and support reaches people when it matters most.
Technology USED
- Figma, Adobe XD for mockups, prototypes, and handoff