Industry
Healthcare
The Challenge
- Underutilization of Operating Rooms (ORs): Idle time and inefficient use of available ORs.
- Scheduling Inefficiencies: Manual scheduling led to fragmented information across systems.
- Extended Turnover Times: Causing delays between surgeries.
- Patient Risks: Delays increased risks and patient dissatisfaction.
- Lack of Real-Time Visibility: Limited ability to track and monitor OR schedules dynamically.
Scope of Project
- Implement a data-driven solutionto optimize operating room utilization.
- Provide real-time visibility into OR scheduling, staff allocation, and delays.
- Enable management to identify peak usage, idle times, and resource constraints.
- Incorporate predictive analytics to forecast demand and improve planning.
Solution Provided
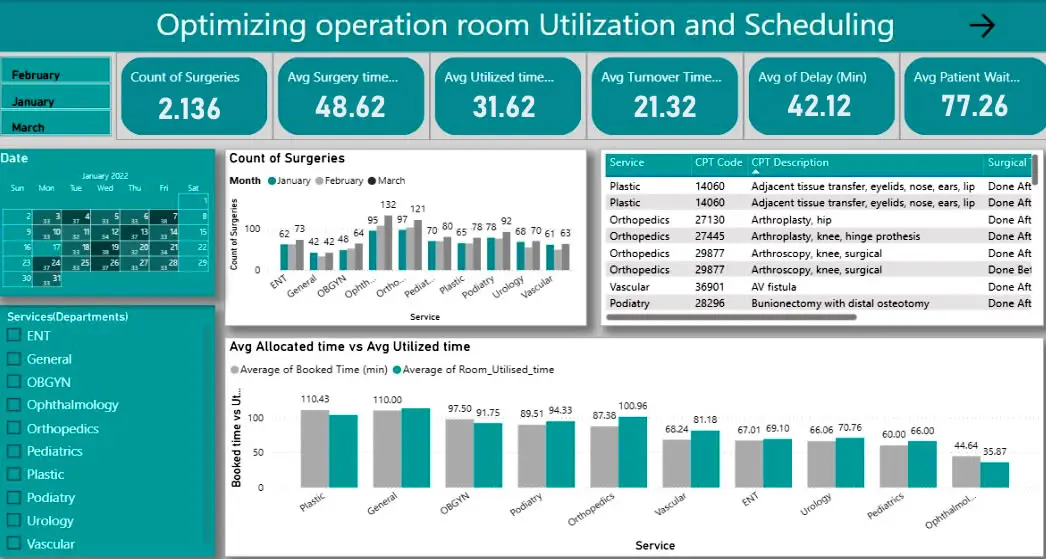
A comprehensive Power BI dashboard was developed to unify operating room utilization data, surgical schedules, and staff assignments into a single view. The project involved preparing and integrating data from multiple sources, ensuring consistency and accuracy before visualization.
The dashboard was designed to track key KPIs such as utilization rates, turnover times, and schedule adherence, while offering real-time monitoring that enabled hospital administrators to quickly adjust resources and reduce delays.
To support long-term planning, predictive analytics were incorporated, leveraging historical patterns to forecast OR demand and identify recurring bottlenecks. The dashboards were also built with interactive features, allowing users to drill down by department, surgeon, or time period, transforming reporting into a powerful decision-support tool.
- Developed a Power BI dashboard integrating OR utilization data, surgical schedules, and staff assignments.
- Data Preparation: Collected, cleaned, and transformed data from multiple sources using Excel and integrated into Power BI.
- KPI Tracking: Monitored utilization rates, turnover times, and adherence to planned schedules.
- Predictive Analytics: Forecasted OR demand based on historical usage patterns.
- Interactive Dashboards: Allowed hospital management to analyze data, reduce delays, and make informed decisions.
Business Impact
- Increased OR Utilization: Reduced idle time and improved resource usage.
- Improved Revenue & Efficiency: Optimized scheduling increased throughput, resulting in higher operational efficiency.
- Reduced Patient Wait Times: Faster scheduling and reduced delays improved patient satisfaction.
- Enhanced Decision-Making: Real-time dashboards empowered leadership with actionable insights.
- Future-Readiness: Predictive analytics provided a foundation for continuous process improvements.
Technical Architecture
- Visualization Tool: Power BI (with DAX functions, calculated columns, interactive dashboards).
- Data Source: Excel, hospital scheduling systems.
- Data Processing: Data cleaning, transformation, and integration workflows.
- Analytics: Real-time dashboards, KPI visualization, predictive analytics models.