
The Challenge
- Lack of centralized visibility into HR metrics (e.g. employee turnover, hiring pipeline, absenteeism, performance) across departments.
- Delayed or static reporting—HR reports were periodically generated (monthly or quarterly), limiting ability to respond quickly to emerging issues.
- Data silos—information about employee demographics, performance reviews, training, and attrition were stored in different systems, making it hard to correlate metrics.
- Difficulty identifying patterns or anomalies—for example sudden spikes in turnover, low training completion in particular teams, or high absenteeism—due to limited drill-down capability.
- Manual data processing burden—HR staff spent significant time aggregating and cleansing data to prepare reports.
Scope of the Project
- Build an interactive HR Dashboard to enable leadership and HR teams to monitor critical personnel metrics in near real time.
- Consolidate HR data from various sources (HRIS, performance management, recruiting, training, attendance systems).
- Provide visualizations for key metrics like headcount, attrition, hiring status, training compliance, employee performance, absenteeism.
- Enable filters and drill-down by department, location, role, time period to allow team-specific insights.
- Automate reporting and dashboards to reduce latency and manual work.
The Solution
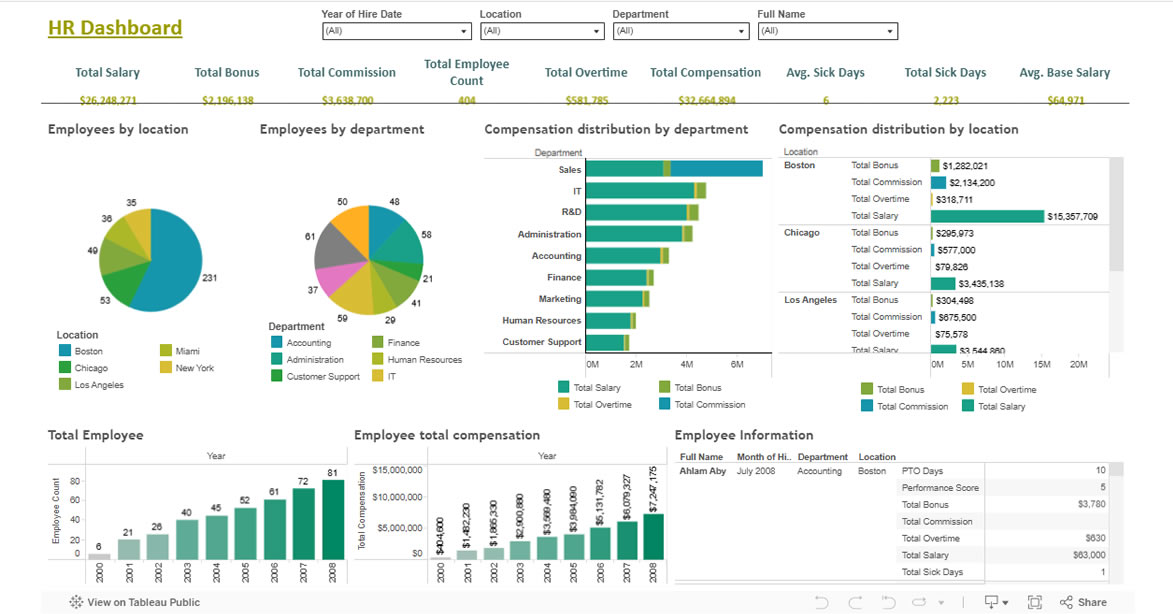
- Designed and developed a Tableau-based HR Dashboard showing key HR metrics in an at-a-glance format:
- Employee headcount trends over time
- Turnover rates by department/location
- Hiring pipeline (open roles, candidates, time to hire)
- Training compliance and completion rates
- Absenteeism and leave trends
- Performance rating distributions and evaluation status
- Data integration: pulled together data from HRIS, recruiting systems, attendance / time tracking tools, learning management systems, performance review platforms.
- Data transformation and preparation: standardizing employee role titles, handling missing data, ensuring consistency in categorization (locations, departments).
- Dashboard interactivity: filters by department, location, role, time period; ability to drill down into specific groups; comparisons over time (month-over-month, year-over-year).
- Automated refresh: schedule data extracts and refreshes to keep dashboards up to date.
- Visualization design: user-friendly layout, clear KPIs, color-coded alerts or signals for metrics outside of thresholds.
Business Impact
| Impact Area | Results / Benefits |
| Improved Decision-Making | HR leadership can now identify rising turnover in specific departments early, enabling targeted interventions before loss becomes critical. |
| Efficiency Gains | Reduced time for HR reporting by ~50–70%, freeing HR team to focus on strategic initiatives rather than manual data compilation. |
| Better Visibility | Continuous visibility into hiring pipelines helps avoid staffing shortages and react faster when hiring lags. |
| Training Compliance | With dashboard tracking, increased training completion rates and better compliance with required learning modules. |
| Reduced Absenteeism Impact | Monitoring absenteeism patterns allowed HR to spot problematic trends (departments with high unscheduled leave) and address underlying causes. |
| Employee Engagement & Retention | Transparent performance review metrics and faster resolution of HR issues improve employee satisfaction and retention. |
Technology Used
- Visualization / BI Tool: Tableau Desktop / Tableau Server (or Tableau Online)
- Data Sources: HR Information System (HRIS), Recruiting / ATS system, Learning Management System (LMS), Attendance / Time Tracking, Performance Review Tools
- Data Storage / ETL: SQL Database / Data Warehouse for staging and integrating HR data; data cleaning and transformation pipelines
- Automation / Scheduling: Automated extracts / refresh schedules for dashboard data to remain current
- User Access & Security: Role-based dashboard access, filters to control visibility (e.g., managers see only their own team data)