The Challenge
The client needed a centralized system to track the status of multiple projects across departments. With numerous teams handling different responsibilities, there was no clear visibility into:
- How projects were progressing through different stages (Backlog, Design, Development, Production, Testing).
- The percentage of work completed, in progress, or delayed.
- Consolidation of data coming from multiple systems into a single, actionable view.
Managing data quality and consistency across multiple sources was a major hurdle. Project tracking was largely manual, time-consuming, and prone to errors, which created delays in decision-making and resource allocation.
Scope
To develop a centralized project tracking dashboard using Tableau, enabling executives to monitor project progress in real time.
Key objectives:
- Consolidate data from multiple sources into a standardized reporting format.
- Provide visibility into project stages and departmental performance.
- Automate reporting to reduce manual effort and human error.
- Deliver actionable insights for better resource allocation and planning.
Solution
A Tableau-based analytics solution was implemented to address these challenges:
- Dashboard Design & Implementation
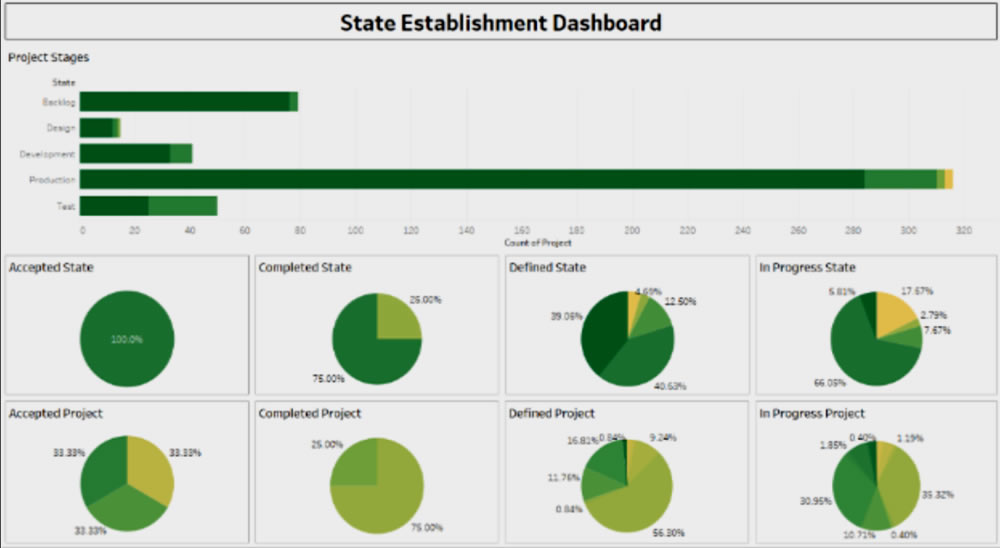
- Built interactive dashboards in Tableau Desktop to visualize project progress.
- Created tabular reports and integrated them into dashboards for quick insights.
- Displayed project stages (Backlog, Design, Development, Production, Testing) with real-time status tracking.
- Developed KPIs to show project percentages (Accepted, Completed, Defined, In-Progress).
- Data Integration & Cleansing
- Integrated multiple data sources into a single, centralized platform.
- Conducted extensive data extraction, transformation, and cleansing to ensure accuracy.
- Deployment & Scalability
- Published dashboards to Tableau Server for enterprise-wide access.
- Enabled drill-down analysis for department-level performance tracking.
Business Impact
| Impact Area | Results Achieved |
| Project Visibility | Achieved complete visibility of all projects across departments, improving transparency. |
| Decision-Making | Reduced time to identify project delays and bottlenecks, enabling faster resource allocation. |
| Operational Efficiency | Eliminated manual project tracking processes, saving 40% of reporting effort. |
| Data Accuracy | Improved reporting accuracy through automated data integration and cleansing. |
| Performance Monitoring | Real-time project metrics allowed leadership to track growth and project health at any time. |
| Cross-Team Collaboration | Created a unified source of truth, improving communication and accountability between departments. |
Technology Environment
- Visualization & Analytics: Tableau (core dashboard platform).
- Data Sources: MES, ERP, SCADA, Quality Systems.
- Data Integration: ETL pipelines for real-time feeds.
- Database: SQL-based storage for structured production and quality data.