Industry :
Retail
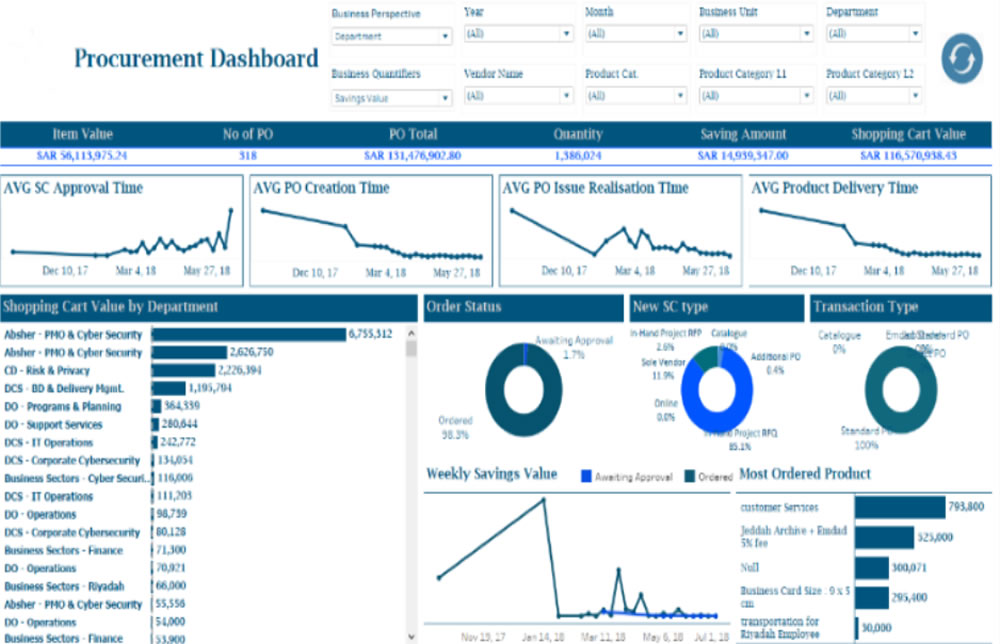
The Challenge
The client needed a robust analytics solution to gain deeper insights into their procurement processes and improve operational efficiency. Key challenges included:
- Providing senior management with monthly, quarterly, and half-yearly performance reports in a clear and consistent format.
- Ensuring data consistency across departments by sharing validated insights weekly.
- Extracting and preparing procurement data from ServiceNow web services, which required complex parsing and transformation before being usable.
- Managing data in formats unsuitable for direct visualization, requiring advanced data modeling and cleansing.
- Understanding domain-specific procurement metrics in order to create meaningful dashboards and KPIs.
- Consolidate and analyse data across locations and product lines.
- Implement secure, role-based access to sensitive data.
- Improve reporting performance and reduce manual effort.
Solution
A comprehensive data preparation and visualization framework was implemented, integrating Alteryx for data processing and Tableau/Power BI for reporting. The approach included:
- Data Extraction & Transformation
- Used Alteryx to connect with ServiceNow, parse unstructured data, and perform RegEx-based pattern matching.
- Modeled and transformed data into Tableau-compatible .TDE files for efficient use.
- Interactive Dashboards & Reports
- Designed dual-axis charts, combo charts, heat maps, geographic maps, small multiples, and drill-through reports to provide multi-dimensional insights.
- Developed calculated fields and parameters for custom KPIs aligned with procurement goals.
- Built interactive dashboards tailored to management requirements.
- Performance & MIS Reporting
- Automated generation of daily, weekly, and monthly procurement reports.
- Created MIS and performance dashboards for procurement and client service teams.
- Designed standardized reporting formats for consistent communication across departments.
- Publishing & Scheduling
- Published dashboards and data sources to Power BI Online Services.
- Scheduled refreshes (daily/weekly/monthly) to ensure real-time accuracy.
Business Impect
- Improved Procurement Efficiency: Senior management gained clear visibility into procurement KPIs, enabling faster and more accurate decision-making.
- Time Savings in Data Preparation: Automated data extraction and transformation with Alteryx reduced manual effort by over 40%.
- Faster Insights: Interactive dashboards allowed executives to drill down into procurement details instantly, cutting analysis turnaround times from weeks to hours.
- Consistency Across the Organization: Weekly reviews ensured that all departments had access to standardized, reliable data for planning and execution.
- Scalable Reporting Framework: The solution enabled easy addition of new data sources, KPIs, and visualization requirements without disrupting existing workflows.
Tools & Technology Environment
- Data Preparation: Alteryx (Parsing, RegEx, Data Extraction)
- Visualization: Tableau, Power BI
- Data Sources: Service Now Web Services