Industry
Supply Chain & Inventory Management
Challanges
Challenges The business was heavily dependent on an outdated Excel-based reporting system to track critical inventory and supply chain metrics. This system could not scale with the increasing complexity of data, nor could it provide timely or detailed insights. Reports were often delayed, prone to errors, and lacked the ability to drill down into granular details. As a result, decision-making was reactive rather than proactive, leading to issues such as stockouts, overstock situations, and inefficient resource allocation across warehouses and regions.
Scope of the Project
The project aimed to replace the manual Excel reporting system with a modern, automated, and scalable analytics solution. The scope included:
- Migrating reporting from Excel to Tableau using the Infinity data source.
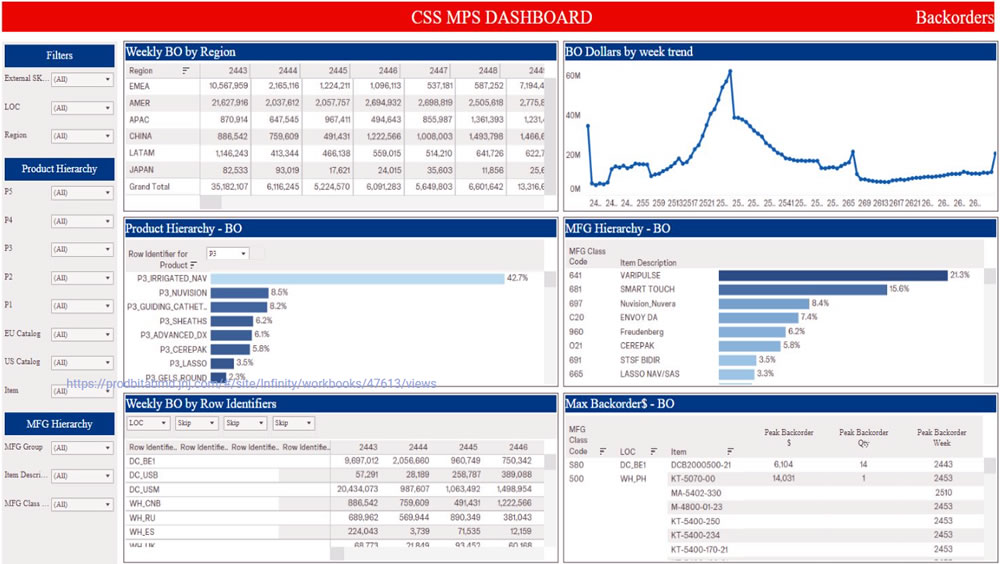
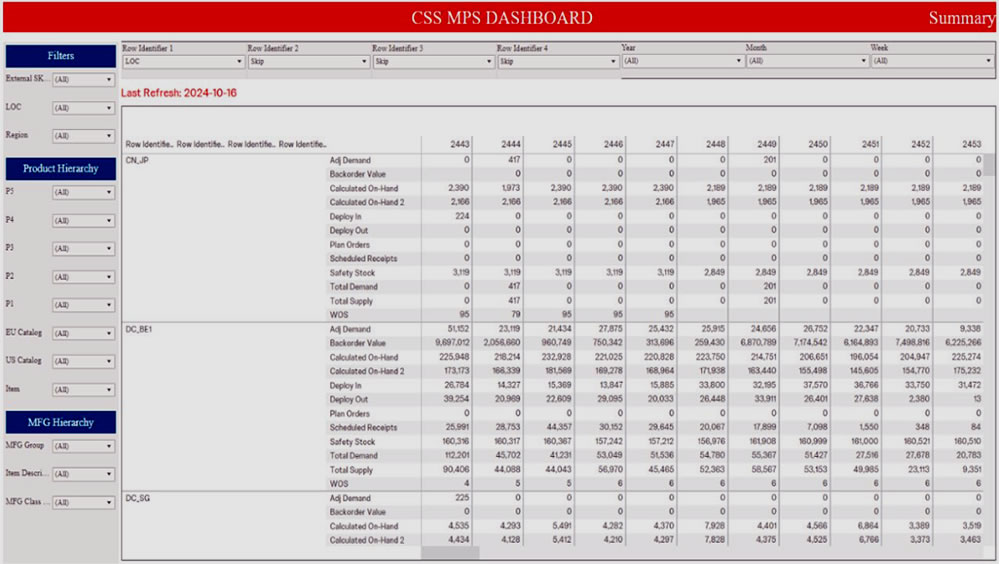
- Building a Master Production Schedule (MPS) Dashboard to monitor inventory and supply chain metrics.
- Offering historical, summary, and Weeks of Supply (WOS) views at multiple hierarchy levels (item, location, and region).
- Ensuring data integrity and real-time updates to improve decision-making.
Solution Provided
A comprehensive solution was designed to streamline data preparation, reporting, and visualization.
- Data Preparation and Processing:
Raw data from multiple systems was integrated through the Infinity platform and processed using Alteryx. Existing macros were enhanced with new formulas to clean, transform, and standardize the data at item, location, and region levels. This created a reliable foundation for accurate reporting. - Master Production Schedule (MPS) Output:
The processed data was used to generate a detailed MPS output, which included metrics such as Weeks of Supply (WOS), backorders, calculated on-hand inventory, deploy-in/out movements, plan orders, and safety stock levels. - Interactive Tableau Dashboards:
The MPS output was visualized in Tableau, with dashboards designed to provide historical views, summary reports, and WOS analysis. Drill-down capabilities allowed users to analyze performance at granular levels, such as by warehouse, product line, or region. - Automation and Real-Time Insights:
Automated workflows in Alteryx and Tableau ensured weekly updates with minimal manual intervention. This provided near real-time visibility into stock levels, demand, and supply chain risks. - Actionable Analytics:
The dashboards enabled supply chain teams to quickly identify inefficiencies, manage stock movements, and balance inventory across locations. Early warnings for potential stockouts or overstock situations allowed timely corrective actions.
Business Impact
- Improved Efficiency: Automated updates significantly reduced manual effort, freeing teams to focus on strategic planning rather than data preparation.
- Real-Time Visibility: Managers could monitor inventory, backorders, and WOS across all locations with up-to-date insights.
- Risk Reduction: Proactive identification of supply-demand imbalances minimized the risk of stockouts and excess inventory.
- Faster Decision-Making: Interactive dashboards and drill-down analysis enabled leaders to act quickly and confidently.
- Scalability: The solution established a foundation that could easily adapt to growing data volumes and additional KPIs.
Technical Architecture
- Data source: Infinity (inventory and supply chain systems).
- Data Processing & ETL: Alteryx (data cleaning, transformation, aggregation, macros, and formula enhancements)
- Visualization & Reporting: Tableau (MPS dashboards, historical views, summary views, WOS analysis)
- Automation: Scheduled workflows and automated data refreshes in Alteryx and Tableau